
Stock Market Statistics
AT40 = 56.6% of stocks are trading above their respective 40-day moving averages (DMAs)
AT200 = 14.5% of stocks are trading above their respective 200DMAs
VIX = 31.9
Short-term Trading Call: neutral
Stock Market Commentary
The week began with sellers finally drawing a line in the sand. The week ended with a counter from buyers twice defending against gap downs in the major indices. The end result was a stalemate that has now extended into a month-long trading range on the S&P 500 (SPY) and potential exhaustion for the previous rally in the NASDAQ (COMPQX).
The Stock Market Indices
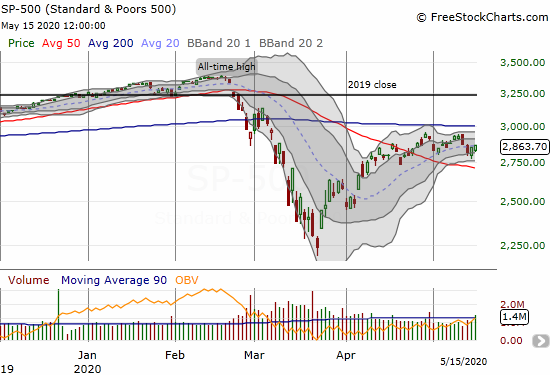
The S&P 500 (SPY) gained 0.4%. While the week ended with a net loss, enough buyers showed up to scoop up “bargains” after sellers gapped the market down on Thursday and Friday. Buyers postponed a test of 50DMA support for another day. Overhead resistance at the 200DMA looks more ominous than ever.
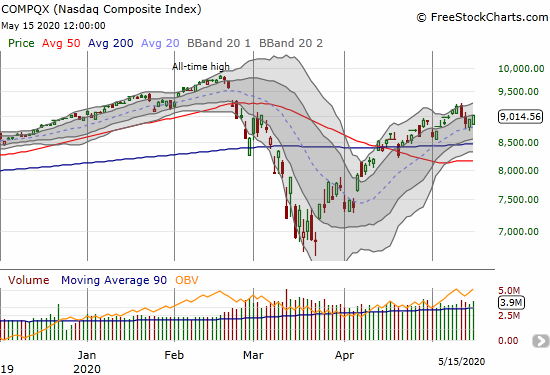
The NASDAQ (COMPQX) outperformed the S&P 500 with a 0.8% gain. Buyers stepping into Thursday and Friday’s gaps also successfully defended support at the uptrending 20DMA. With the 20DMA as my guidance I jumped into a weekly calendar call spread on Invesco QQQ Trust Unit (QQQ).
Volatility
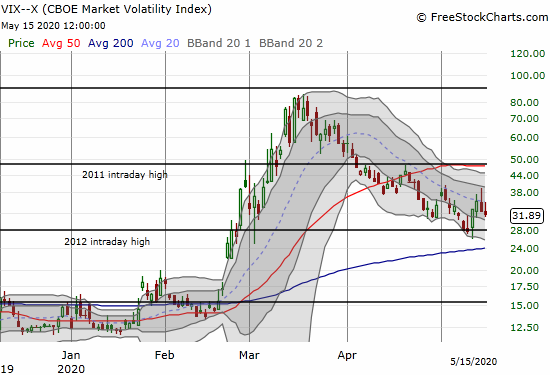
The volatility index (VIX) had a wake-up call and looked ready to break through its downtrend from the March highs as measured by the 20DMA. Faders stepped in on Thursday and brought a rallying VIX back under control. The VIX now looks ready to stay in an elevated range. I cannot imagine the VIX making a new low while I am still assuming the top is in the market for the short-term.
The Short-Term Trading Call
AT40 (T2108), the percentage of stocks trading above their respective 40DMAs, closed at 56.6%. My favorite technical indicator has essentially confirmed a short-term top in the market with all the bearish implications. However, as I have mentioned several times before, there is no point in rushing to short the market since both major indices remain well-supported from below at 50DMAs. The NASDAQ in particular remains in a bullish position with a confirmed breakout above its 200DMA. On balance, this stalemate means waiting, patience, and exploring the sidelines are short-term virtues. Only very select stock setups get my interest in times like these.
Stock Chart Reviews – Below the 50DMA
3M Company (MMM)
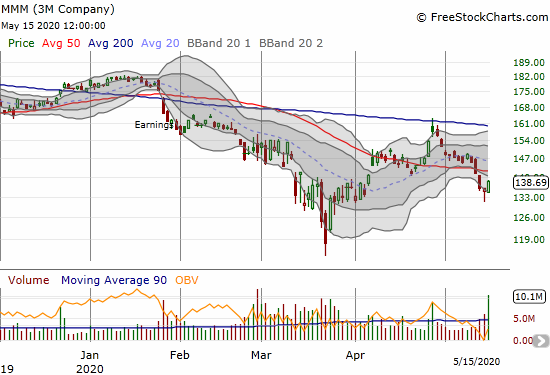
3M Company (MMM) returned to a bearish position with last week’s 50DMA breakdown. That breakdown confirmed the bearish implications of the stock’s failure right at 200DMA resistance last month. I am still clinging to shares in MMM.
Stock Chart Reviews – Above the 50DMA
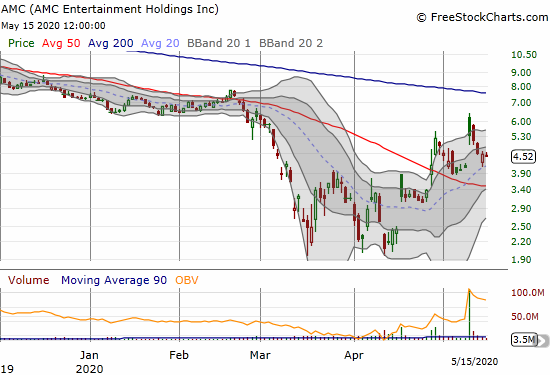
AMC Entertainment Holdings (AMC)
I almost pulled the trigger on AMC Entertainment Holdings (AMC) twice. AMC faded from merger Monday rumors of a buyout from Amazon.com. The story is believable given movie theaters are so cheap and Amzon.com has so much money. The company can afford this kind of speculation and bet on a future far over the horizon. With no confirming news and plenty of market skepticism, AMC eventually closed Monday’s gap right at uptrending 20DMA support. I now like the stock just from a technical standpoint as a play on a 20DMA bounce. I just hope a fresh rumor does not unfold on the next merger Monday…
Amazon.com (AMZN)
My weekly calendar call spread on Amazon.com (AMZN) worked out even better than I could have expected. I am officially putting the post-earnings AMZN trade back into the toolkit: buy AMZN on the first post-earnings day no matter what. AMZN is currently settling into a kind of trading range that includes the post-earnings gap down at the beginning of the month.

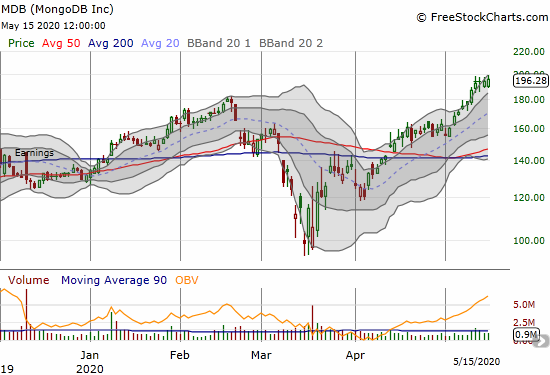
MongoDB Inc (MDB)
As an innovative database provider, MongoDB Inc (MDB) is a key component of the new digital economy. I strongly suspect that one day in the near future some bigger technology company desperate for growth drivers will gobble up MongoDB. I never made a move on the stock after last month’s unspectacular 50/200DMA breakout last month. My next opportunity will have to come from buying a call spread and/or waiting post-earnings in June for some kind of dip.
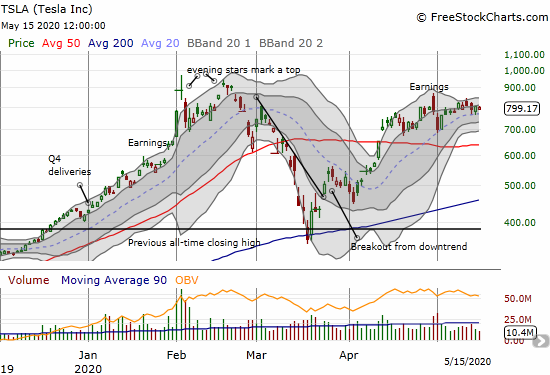
Tesla (TSLA)
My Bollinger Band (BB) squeeze trade on Tesla (TSLA) has effectively fizzled out. The market’s sell-off in the beginning of the week sufficiently dampened buying enthusiasm in TSLA. I pulled the lever on one more weekly calendar call spread at the $850 strike while maintaining the weekly $900 call left over from last week’s calendar call spread.
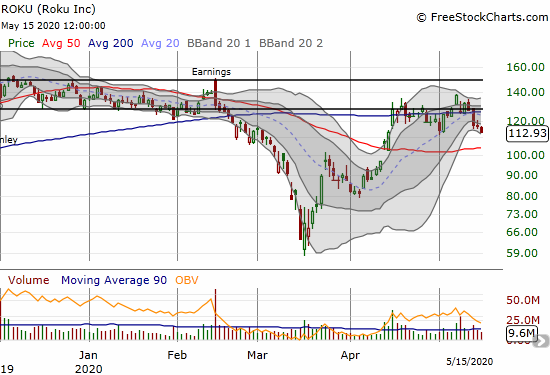
Roku (ROKU)
Roku (ROKU) got my attention on Friday as the stock looks like it is failing from a previous 20DMA pivot. I opened up a weekly put calendar spread at the $105 strike. I did not go for outright puts because ROKU’s behavior is so volatile. I am bracing for a rebound before selling resumes to at least 50DMA support.
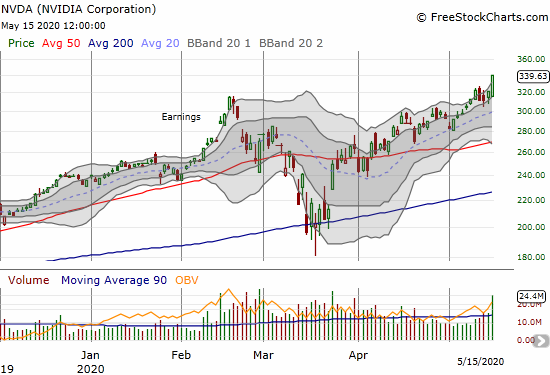
NVIDIA Corporation (NVDA)
Chipmaker NVIDIA Corporation (NVDA) is another clear winner for the new digital economy. Unfortunately, I took this one off my radar. Earnings are coming up May 21st after market hours. I can only hope for some kind of buyable dip.
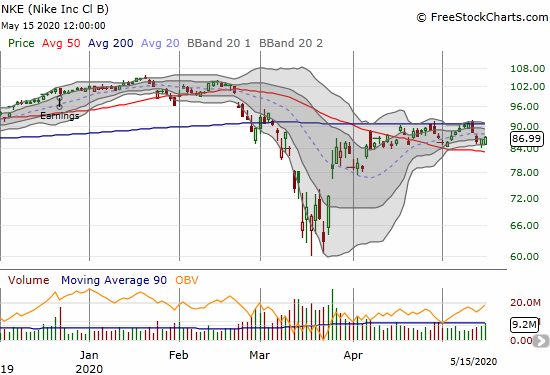
Nike (NKE)
Nike (NKE) is in limbo bouncing between its 50 and 200DMAs. I want to trade NKE aggressively in the direction of whatever key threshold gives way: 200DMA resistance or 50DMA support. I am impressed Nike is even trading this high. I guess people are prioritizing expensive sport shoes in their shrinking budgets?
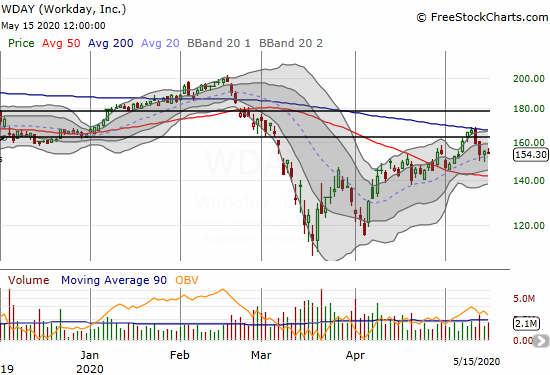
Workday (WDAY)
I sold Workday (WDAY) at 200DMA resistance. I am already looking to start buying back in after the stock held at 20DMA support. However, I am going to try to hold out for a test of 50DMA support. Given the awful employment and business climate, I cannot imagine WDAY returning to a growth mode for a while.
Stock Chart Reviews – Bullish Breakout
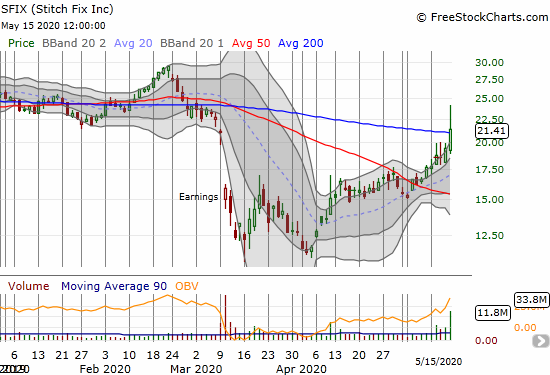
Stitch Fix (SFIX)
I have been sitting in digital outfitter Stitch Fix (SFIX) for a while waiting for the market to recognize that it is another play on the new digital economy. After a 25% post-earnings loss in March, I thought I would have to concede “defeat.” Some kind of redemption may finally be at hand. On Friday, SFIX soared 10.1% and broke out above its 200DMA. SFIX closed its March gap down although it did suffer a sharp fade from its intraday high of $24.
I am developing new approaches to such runaway breakouts. Since I already have a position in SFIX, I will grow the position with a new covered call position. I call this approach my “no regret” bullish position. If the stock gets called away, I lock in a small profit alongside the strong gains for my uncovered shares. If the call option expires worthless, I get the new shares for a discount. If the price remains high enough, I could even sell another call option against the new shares.
If I did not have a position, I might still start with a covered call position. Alternatively, I might wait for a confirmation of the breakout before buying the stock outright. A confirmation means buyers manage to pull off a second positive close above the breakout threshold. Without the discount from the short call, I would stop out of my new shares on a failed breakout.
— – —
FOLLOW Dr. Duru’s commentary on financial markets via email, StockTwits, Twitter, and even Instagram!
“Above the 40” uses the percentage of stocks trading above their respective 40-day moving averages (DMAs) to assess the technical health of the stock market and to identify extremes in market sentiment that are likely to reverse. Abbreviated as AT40, Above the 40 is an alternative label for “T2108” which was created by Worden. Learn more about T2108 on my T2108 Resource Page. AT200, or T2107, measures the percentage of stocks trading above their respective 200DMAs.
Active AT40 (T2108) periods: Day #24 over 20%, Day #18 over 30%, Day #16 over 40%, Day #15 over 50%, Day #2 under 60%, Day #4 under 70%
Daily AT40 (T2108)
")
Black line: AT40 (T2108) (% measured on the right)
Red line: Overbought threshold (70%); Blue line: Oversold threshold (20%)
Weekly AT40 (T2108)

*All charts created using FreeStockCharts unless otherwise stated
The T2108 charts above are my LATEST updates independent of the date of this given AT40 post. For my latest AT40 post click here.
Be careful out there!
Full disclosure: long SSO shares, short TSLA shares and long TSLA calendar call spread and call, long SFIX, long ROKU calendar put spread, long QQQ calendar call spread, long MMM
*Charting notes: FreeStockCharts stock prices are not adjusted for dividends. TradingView.com charts for currencies use Tokyo time as the start of the forex trading day. FreeStockCharts currency charts are based on Eastern U.S. time to define the trading day.