
AT40 = 48.5% of stocks are trading above their respective 40-day moving averages (DMAs)
AT200 = 50.2% of stocks are trading above their respective 200DMAs
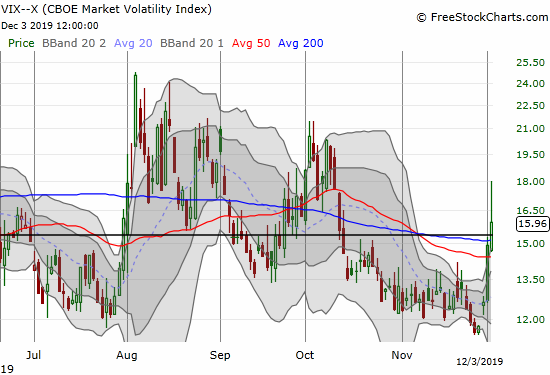
VIX = 16.0 (up 7.0% and went as high as 18.0)
Short-term Trading Call: neutral
Stock Market Commentary
It was fun for the short time it lasted.
The speculative turn in the stock market came to an abrupt end with a fresh set of trade headlines. During a press conference in Europe, President Trump shared his latest revelation about trade negotiations: it turns out that a trade deal, partial or not, might be better done after next year’s Presidential election. The stock market disagreed…for now anyway.
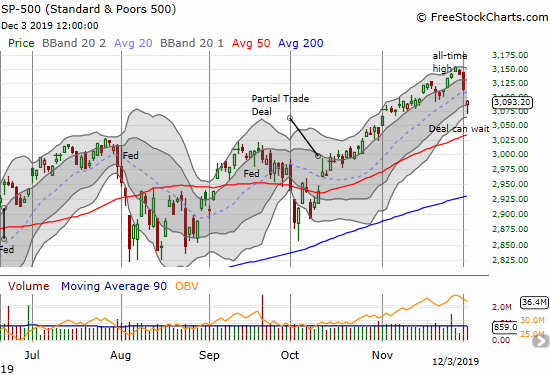
The S&P 500 (SPY) lost 0.7% in a continuation of Monday’s selling pressures. Buying pressure at the lows of the day was enough to create a hammer candlestick that is often characteristic of a bottom. I did not wait for a confirmation and decided to buy a SPY call option expiring in two Fridays. At the lows of the day, sellers finished a 3-day reversal of nearly a month of gains. These kind of sharp u-turns are characteristic of the reversals that follow a period of deep complacency.
However, the market has experienced plenty of these bouts of trade-related angst only to exit stronger than before. I think this episode will play out the same way. This week’s selling put a small dent in the near relentless gains the S&P 500 achieved after the idea of a Partial (Phase One) Trade Deal was floated in early October. Today’s headlines of course confirm what skeptics like me assumed: there was never a firm deal on the table.
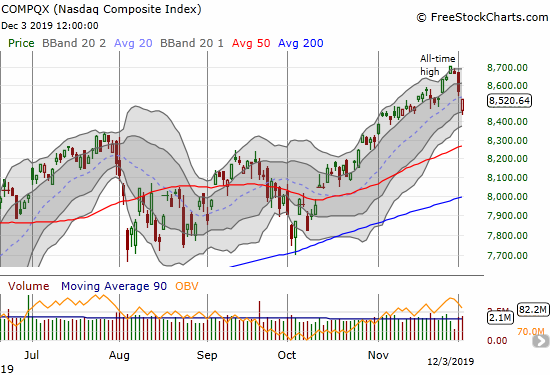
The NASDAQ (COMPQX) lost 0.6% after buyers rushed in right from the gap down open.
AT40 (T2108), the percentage of stocks trading above their respective 40-day moving averages (DMAs), fell sharply alongside the stock market. AT40 closed Friday at 59.0% and still looked ready to make a run at the overbought threshold of 70%. Today, AT40 traded as low as 44% in a move that puts the stock market in what I call a “quasi-oversold” condition. The two-day selling was so extreme that on a relative basis a relief rebound is highly likely. The rush of buyers at the lows of the day may have already launched the relief party.
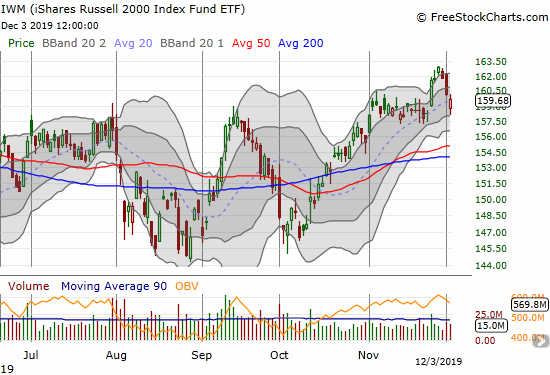
Small Caps Make A U-Turn
It was too much to ask the iShares Russell 2000 Index Fund ETF (IWM) to sustain a breakout. After closing above its upper Bollinger Band (BB) three days in a row, IWM sold off three days in a row. I treated the reversal as a fresh buying opportunity for call options. I will stay positive on IWM as long as it trades above the low of last month’s consolidation pattern that formed the launchpad for the breakout.
Volatility
The complacency in the stock market that fueled the speculative turn did not quite reach the extremely low level that carries bullish implications. The VIX closed at 11.5 at its lows last week. The gap up and jump on “Black Friday” was a small clue that the period of low volatility was likely coming to an end. However, faders showed up in force today, so the sudden surge in angst may already be coming to an end.
The Trading Call
In my last Above the 40 post, I explained why I did not change my trading call from neutral to at least cautiously bullish. This week’s selling validated my hesitation. The complete u-turn from the breakout that marked the speculative turn in the market would have forced me to churn the trading call right back to neutral. Ironically, I would have done so just at the time when selling created better buying opportunities. While the pending tariff deadline on December 15th should keep a lid on prices, I am still more interested in looking for buying opportunities given the season. Note well that the maximum 1.5% drawdown so far in December is right under the average maximum drawdown for this month (1.7%).
In other words, churn going into the 15th may create a lot of pent-up buying pressure no matter whether tariffs are rolled out or not. I can only imagine the surge if a U.S. government official spins more tales of “constructive trade talks.” Stay tuned!
Stock Chart Reviews – Below the 50DMA
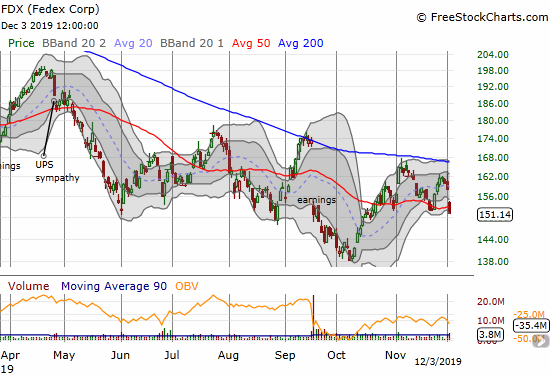
Federal Express (FDX)
Federal Express (FDX) continues to perform as a big laggard. Overhead resistance from a declining 200DMA has held firm for the hapless stock. Today’s gap down and close below 50DMA support placed FDX at a 1 1/2 month low and sets up a potential retest of October’s low.
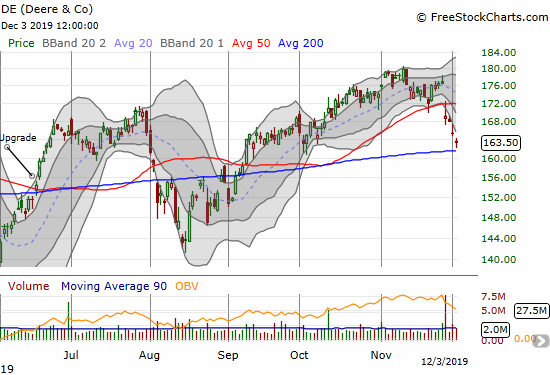
Deere & Co. (DE)
Deere & Co. (DE) is one of those economically sensitive stocks that I do not understand, but I appreciate the technicals. The stock sold off in response to earnings last week (as it should have) and now faces down an important test of 200DMA support. The stock is an aggressive short on a confirmed 200DMA breakdown. Likewise, I will get aggressively bullish on a recovery above 50DMA resistance.
Stock Chart Reviews – Above the 50DMA
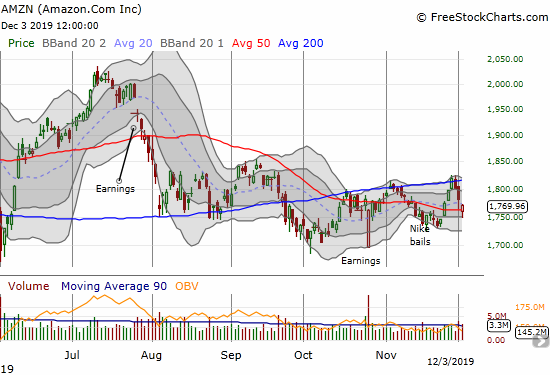
Amazon.com (AMZN)
Amazon.com (AMZN) did not spend long in bearish territory after Nike (NKE) bailed on an experimental partnership. The stock ran into stiffer resistance at its 200DMA just as sentiment turned in the stock market. The last three days of selling threatened to plunge AMZN right back into bearish 50DMA breakdown territory, but buyers just barely nudged the stock above support. I like hedged trades on AMZN for now.
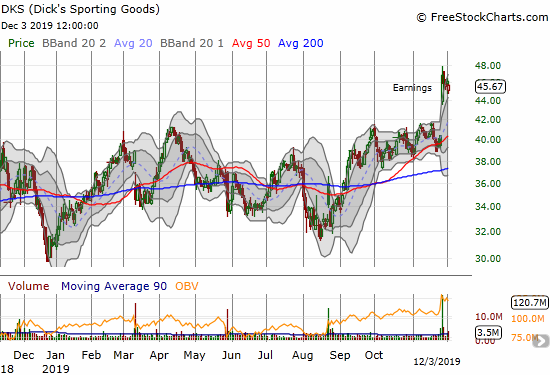
Dick’s Sporting Goods (DKS)
Dick’s Sporting Goods (DKS) is one of the few retailers I always look to buy. So I was feeling a lot of regret as DKS surged to a post-earnings 2 1/2 year high last week without me holding a position. I was caught completely off-guard; I was still in a mode of playing an extended trading range. While I look for a larger pullback to buy, I dove in on the day after the earnings response with shares and a covered call just to make sure I participate in any additional upside from here.
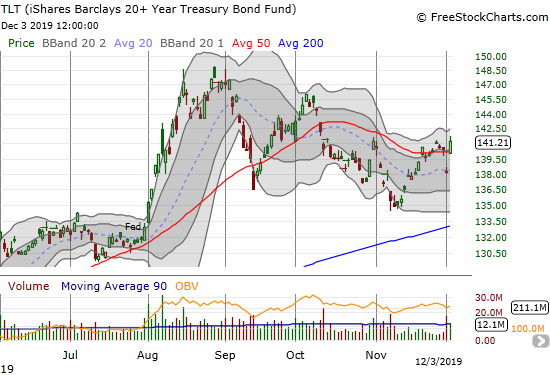
iShares Barclays 20+ Year Treasury Bond Fund (TLT)
I have no idea why interest rates surged on Monday even as the stock market faced obvious selling pressures. The gap down below the 50DMA for the iShares Barclays 20+ Year Treasury Bond Fund (TLT) was so severe I prepared for a test of 200DMA support and a complete erasure of profits on my March call spread. Tuesday’s rebound returned those gains and then some. This churn has me on alert to take profits even as I fully expect TLT to eventually retest October and perhaps even August highs.
— – —
FOLLOW Dr. Duru’s commentary on financial markets via email, StockTwits, Twitter, and even Instagram!
“Above the 40” uses the percentage of stocks trading above their respective 40-day moving averages (DMAs) to assess the technical health of the stock market and to identify extremes in market sentiment that are likely to reverse. Abbreviated as AT40, Above the 40 is an alternative label for “T2108” which was created by Worden. Learn more about T2108 on my T2108 Resource Page. AT200, or T2107, measures the percentage of stocks trading above their respective 200DMAs.
Active AT40 (T2108) periods: Day #224 over 20%, Day #63 over 30%, Day #38 over 40% (overperiod), Day #1 under 50% (underperiod ending 34 days over 50%), Day #11 under 60% (underperiod), Day #51 under 70%
Daily AT40 (T2108)
")
Black line: AT40 (T2108) (% measured on the right)
Red line: Overbought threshold (70%); Blue line: Oversold threshold (20%)
Weekly AT40 (T2108)

*All charts created using FreeStockCharts unless otherwise stated
The T2108 charts above are my LATEST updates independent of the date of this given AT40 post. For my latest AT40 post click here.
Be careful out there!
Full disclosure: long VIXY calls, long IWM calls, long TLT call spread, long AMZN calendar call spread and put spread, long DKS covered call position, long SPY call, long NKE calls
*Charting notes: FreeStockCharts stock prices are not adjusted for dividends. TradingView.com charts for currencies use Tokyo time as the start of the forex trading day. FreeStockCharts currency charts are based on Eastern U.S. time to define the trading day.