
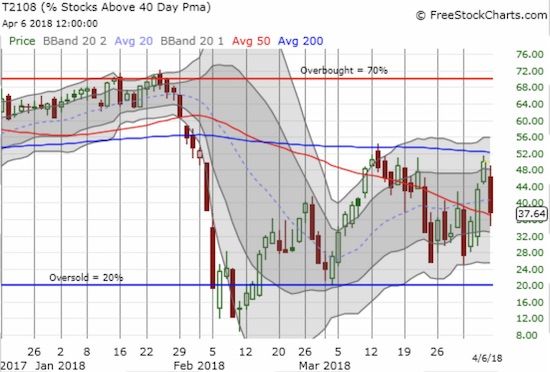
AT40 = 37.6% of stocks are trading above their respective 40-day moving averages (DMAs)
AT200 = 40.2% of stocks are trading above their respective 200DMAs
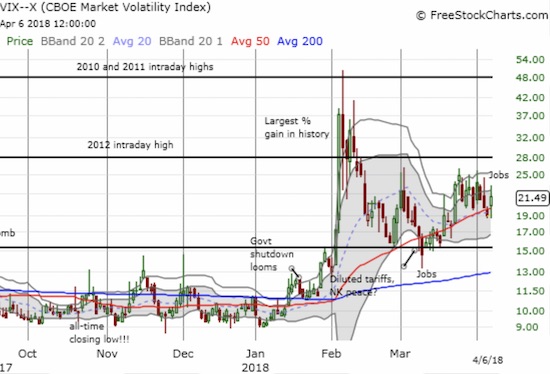
VIX = 21.5
Short-term Trading Call: neutral
Commentary
The week ended badly with a 2.2% drop in the S&P 500 (SPY). The week began with the exact same loss. Between the bookends market participants breathed collective sighs of relief and hope with three up days. Each day this week except one, the S&P 500 touched critical uptrending support at its 200-day moving average (DMA). This test of bear/bull wills at support has created spectacular market reversals as various catalysts have postured, posed, and postured again. It feels like the “barbarians” of sentiment are running amuck with an ultimate resolution still uncertain. I am frankly quite surprised the market managed to stay out of oversold territory this week.
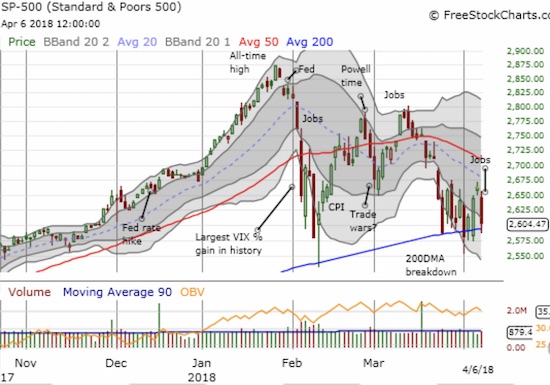
Alongside the churn, AT40 (T2108), the percentage of stocks trading above their respective 40DMAs, flashed encouraging signs. While the S&P 500 has been unable to break free of its 200DMA’s gravitational pull, AT40 ended the week well off recent lows. AT40’s closing high of this week even stopped just short of March’s high. This almost subtle divergence from the languishing of the S&P 500 suggests that fewer and fewer stocks, albeit big and important ones, are participating in the market’s pains. The barbarians banging away at support are smashing fewer and fewer stocks…ever so subtly.
The currency markets have also demonstrated a relative lack of alarm. My favorite indicator of sentiment is the Australian dollar (FXA) versus the Japanese yen (JPY). AUD/JPY hit a low two weeks ago and has chopped higher ever since with more up days than down days. I am astounded the Australian dollar has avoided a massive beating with all the implications of a trade war for its biggest trading partner: China.
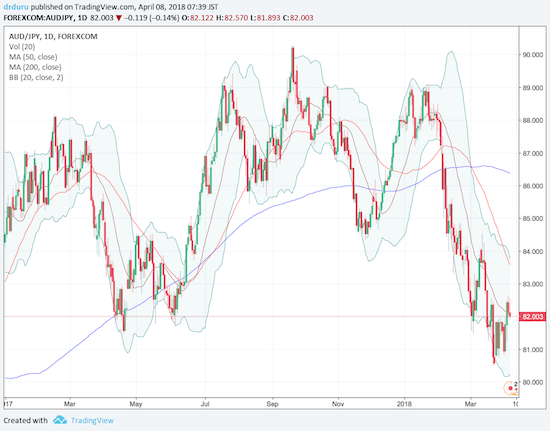
Source: TradingView.com
Even the volatility index, the VIX, is not quite behaving quite as I would expect given the actual volatility in the market. The VIX is not even drifting higher anymore. Instead, the VIX has maintained a trading range for two weeks; the VIX stopped going higher exactly after AUD/JPY bottomed.
My trading range stays firmly at neutral, but I can see the imminent signs of a bottoming. The war cries of the barbarians are frightening, but they are far from cause for panic. However, since the favorable setup can change in an instant with the currently capricious actions of government actors, I am compelled to avoid getting bullish until buyers prove themselves. Until something materially changes, I am assuming more chop ahead and a test of 200DMA support for the tech-laden indices…and trading accordingly. On the bullish side, I bought a fresh round of SPY call options on Friday. Per this choppy environment, I am trying to get better at taking profits quickly.
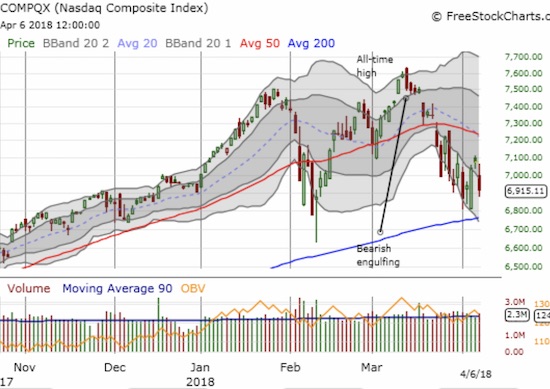
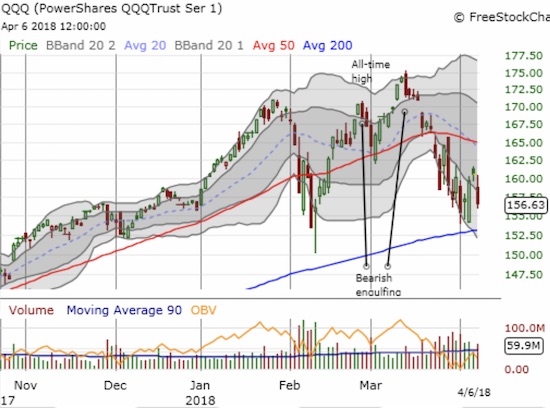
CHART REVIEWS
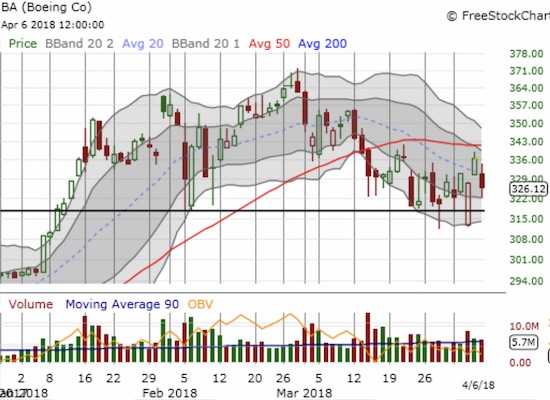
Boeing (BA)
BA is now of great interest to me as a hedge against bullishness in addition to Caterpillar (CAT). BA is widely loved and adored and carries the burden of extremely bullish expectations. Its valuation is very high for what is (has been?) a cyclical stock: 24.3 trailing P/E, 19.5 forward P/E, and 2.1 P/S (the posted 542.6 P/B ratio is not believable). Bears are nowhere to be found with only 1.1% of the float sold short. If anything seriously goes wrong in the market and/or the economy, BA would crater a LOT from current lofty levels.
For trading, BA’s chop is well-defined. I have consistently faded rallies with puts and have been able to sell those puts at profits when the next swing of chop takes the stock market down. BA has yet to close below its February intraday low. Buyers keep saving BA from such a bearish breakdown as consistently as buyers keep saving the S&P 500 from a confirmed bearish breakdown below its 200DMA support.
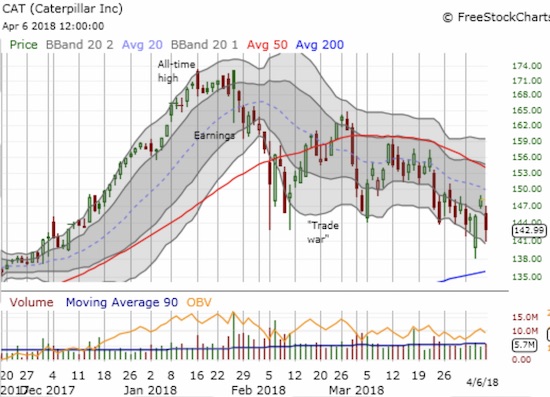
Caterpillar (CAT)
Speaking of CAT, I decided to cover my shares short in the last sell-off in order to free up room for an aggressive buying posture for oversold conditions. The decision was timely as CAT proceeded to rally sharply from its gap down below its lower-Bollinger Band (BB). After I covered, I switched to a hedged position of calls and puts. I promptly took profits on the calls when CAT gapped up the next day (remember the chop!).
While CAT is still a hedge on bullishness, I fully expect CAT to rally a lot more strongly than BA whenever market sentiment turns for the better. At that point, I might quickly switch to a bullish position to play a run-up to at least 50DMA resistance.
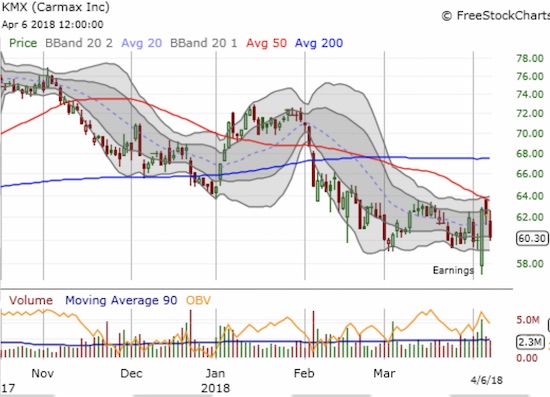
Carmax (KMX)
The chop has also been very frustrating. I happened to have puts ($57 strike) in place ahead of KMX’s earnings. The stock gapped down and placed the puts well into the green. Within 20 minutes, buyers closed that gap. I blinked and opened my eyes to vaporized profits. Sellers returned in the following two days. I decided to double down on the puts in anticipation of KMX retesting its post-earnings low if pressures persist in the stock market.
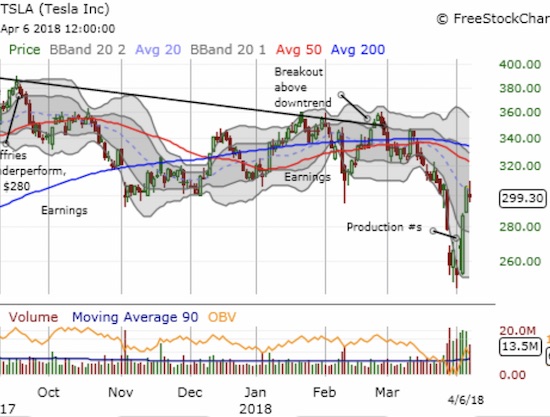
Tesla (TSLA)
Chop threw me off on what I thought was a well-positioned trade on TSLA ahead of the announcement of its production numbers. I used a bounce ahead of the announcement to buy an April $200 put paired with 10 shares. The day ahead of the announcement, TSLA gapped down and traded even lower. My put increased about 50%. I was tempted to take profits, but the profits on the put were not nearly enough to cover my perceived risk in holding the shares. The stocked gapped up on the production news and destroyed the put. The sharp relief rally from there bailed me out much faster than I could have expected. I sold my shares at my $300 upside target on Thursday and escaped even for the position.
TSLA is one manic stock! I am looking to set up new hedged strategies in the near future.
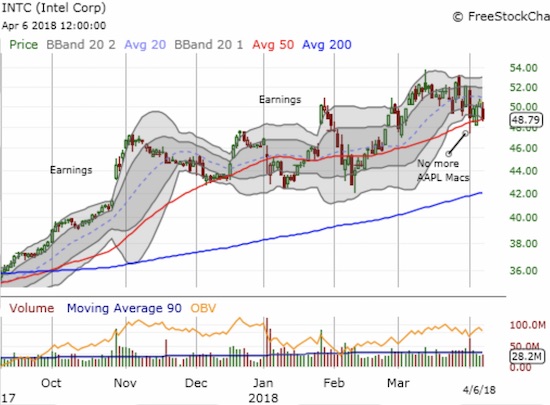
Intel (INTC)
INTC was my worst experience with chop for the week. I discussed the setup in the last Above the 40 post. I was over-weighted with puts even though the stock was flirting with 50DMA support and its lower-Bollinger Band (BB). I saw the puts deliver small but respectable profits at INTC’s lows for the next two days. Each time, buyers took the stock well of its lows by the close of trading and just barely saved the 50DMA as support. When the buyers followed through on Thursday, I promptly took profits on my call options to reduce my loss on the puts. Fittingly, INTC closed the week right on top of 50DMA support.
Other trades related to previous posts: sold half of SSTI and now riding house’s money, sold LEN call options and bought back in on Friday’s selling
— – —
FOLLOW Dr. Duru’s commentary on financial markets via email, StockTwits, Twitter, and even Instagram!
“Above the 40” uses the percentage of stocks trading above their respective 40-day moving averages (DMAs) to assess the technical health of the stock market and to identify extremes in market sentiment that are likely to reverse. Abbreviated as AT40, Above the 40 is an alternative label for “T2108” which was created by Worden. Learn more about T2108 on my T2108 Resource Page. AT200, or T2107, measures the percentage of stocks trading above their respective 200DMAs.
Active AT40 (T2108) periods: Day #35 over 20%, Day #4 over 30% (overperiod), Day #11 under 40% (underperiod), Day #18 under 50%, Day #43 under 60%, Day #49 under 70%
Daily AT40 (T2108)
")
Black line: AT40 (T2108) (% measured on the right)
Red line: Overbought threshold (70%); Blue line: Oversold threshold (20%)
Weekly AT40 (T2108)

*All charts created using freestockcharts.com unless otherwise stated
The charts above are my LATEST updates independent of the date of this given AT40 post. For my latest AT40 post click here.
Related links:
The AT40 (T2108) Resource Page
You can follow real-time T2108 commentary on twitter using the #T2108 or #AT40 hashtags. T2108-related trades and other trades are occasionally posted on twitter using the #120trade hashtag.
Be careful out there!
Additional disclosure: long SPY shares and calls, long CAT puts, short VXX, long KMX puts
*Charting notes: FreeStockCharts.com stock prices are not adjusted for dividends. TradingView.com charts for currencies use Tokyo time as the start of the forex trading day. FreeStockCharts.com currency charts are based on Eastern U.S. time to define the trading day.
Duru,
I suggest you stay away from Tesla. You may find greater success at the roulette wheel than with anything associated with this stock.
There are other things to play out there with a higher probability of success…
I suspect you are right! I looked at the long-term chart and realized that TSLA has essentially gone nowhere for 4 years even with all the hype. The stock has basically enjoyed some brief but very sharp spurts of excitement that are responsible for all the gains all these many years.