
AT40 = 67.0% of stocks are trading above their respective 40-day moving averages (DMAs)
AT200 = 65.2% of stocks are trading above their respective 200DMAs (a TEN MONTH HIGH)
VIX = 11.1
Short-term Trading Call: bullish
Commentary
Once again the stock market was only able to maintain overbought trading conditions for 1 day. At the onset of the last overbought period, I suggested the S&P 500 (SPY) would continue to rip higher. However, a speedbump came in the form of Trump administration churn on the U.S. dollar (USD). On the third day, the dust settled with the S&P 500 emerging with another all-time high.
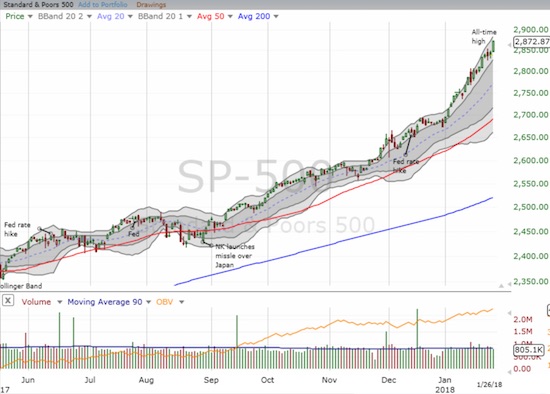
To my slight dismay, AT40 (T2108), the percentage of stocks trading above their respective 40-day moving averages (DMAs), did not come along for the ride. Instead, a very mild bearish divergence emerged as AT40 had to bounce off its lows just to close almost flat on the day. This fresh hesitation suggests to me that the next overbought period, if it comes anytime soon, will be short-lived just like the last two.
The volatility index, the VIX, dipped for only its fourth time in sixteen trading days. The volatility faders gradually regained control last week as the VIX also faded sharply off its highs the two previous days.
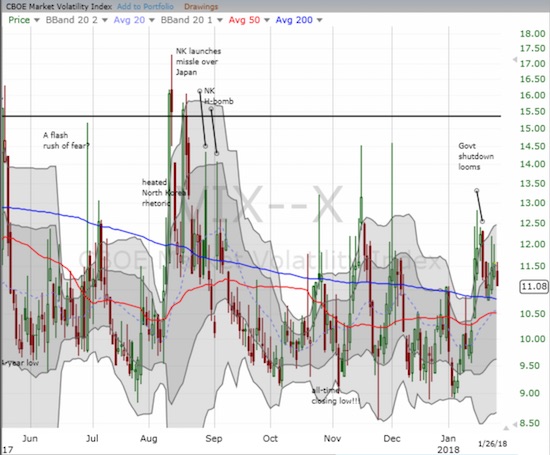
I lost a bit of discipline as I rushed to trade on the churn over the U.S.’s dollar policy. After President Trump attempt to correct Treasury Secretary Mnuchin’s statement in favor of a weaker dollar, I concluded that the flip flop would increase volatility by causing a bit of chaos in trading strategies. I rushed into fresh call options on ProShares Ultra VIX Short-Term Futures (UVXY) that quickly began to languish. With a lot of earnings on tap, an employment report, and a statement on monetary policy coming from the Federal Reserve, there is still a chance that volatility will pick up all over again. It is still remarkable that volatility can stay so slow ahead of such an important week. Regardless, I duly noted how BOTH long and short volatility products lost ground on Friday in a continuing display of dysfunction or least declining utility.
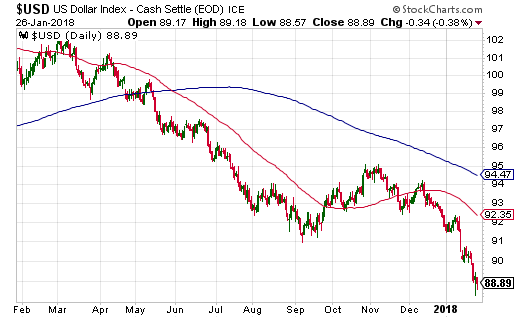
I also rushed into a trade to bet against iron ore which seemingly topped out after another torrid run. I assumed that an end to the sell-off in the U.S. dollar index (USD) would stall out a commodity like iron ore. However, the dollar resumed its weakness to end the week, and my iron ore play rallied all over again. I will dedicate a coming post to my latest iron thinking and trade in coming days.
STOCK CHART REVIEWS
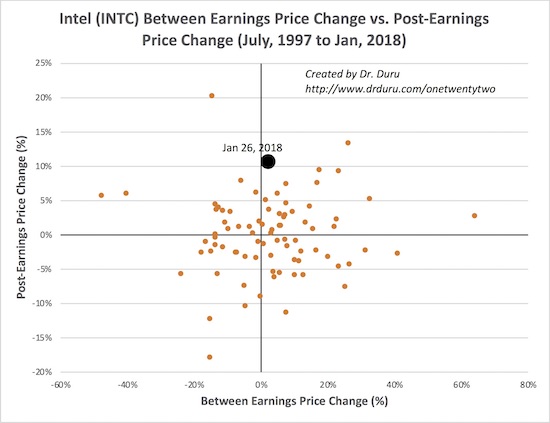
Intel (INTC)
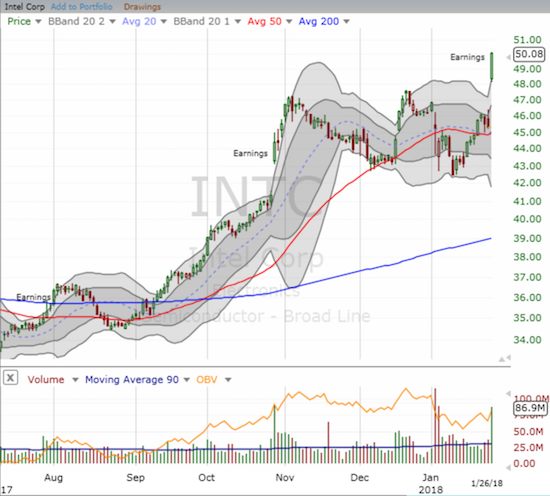
What could have been with INTC.
My on-going preference for trading INTC has been to play between earnings. INTC started the year with a spill over a serious security flaw in its chips. I made one ill-timed bet on a bounce, and then failed to get up and try again. After a 10.0% post-earnings pop all I can do is imagine what could have been. The post-earnings performance was INTC’s third best since 1997. I post below a chart mapping INTC’s between earnings performance (the price change from the last post-earnings close to the pre-earnings close) against the post-earnings one-day price performance. Notice the wide scatter of points in the chart below.
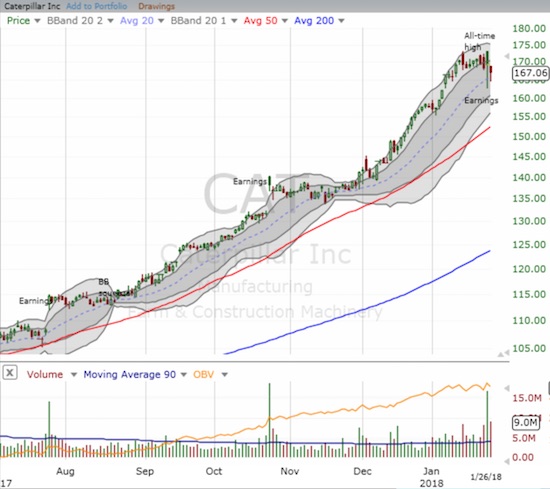
Caterpillar (CAT)
Profit-takers jumped into the fray after CAT reported earnings. The stock dipped as low as $162.46 before buyers rushed back in. I used this dip as my next opportunity to go long call options.
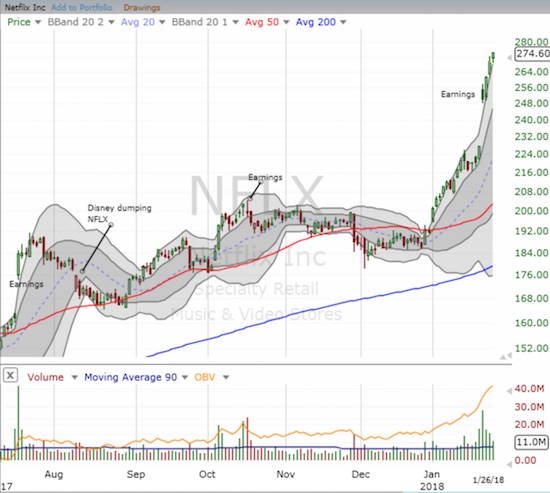
Netflix (NFLX)
NFLX is a poster child of bullish animal spirits. The stock popped to a new all-time high ahead of earnings and after earnings gapped up and gained another 10.0%. I thought that move likely pulled in gains for many weeks, but the stock has not stopped motoring higher yet.
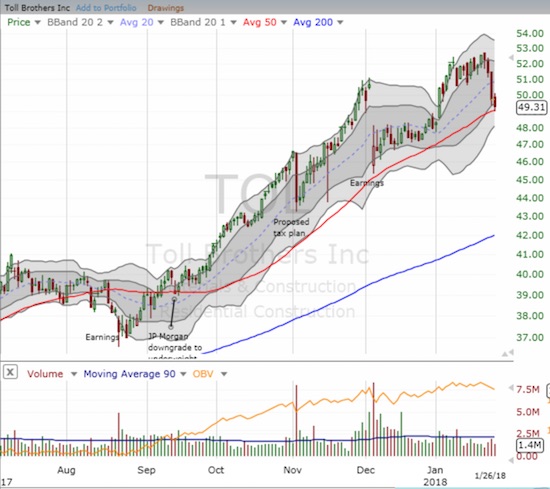
Toll Brothers (TOL)
Home builders are on the defensive as housing data came in “weaker than expected.” Such moments are typically buying opportunities as those expectations mean little past the immediate response in related stocks. I added to my position in KB Home (KBH), and I am now looking to get back into TOL as the stock retests 50DMA support.
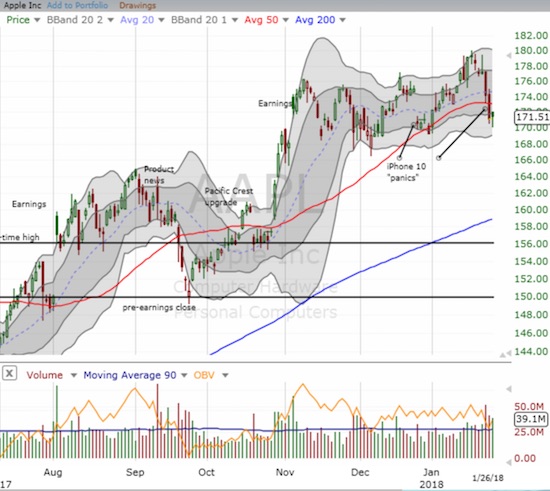
Apple (AAPL)
AAPL is one of many big boys reporting earnings this week. Like INTC, AAPL is coming into earnings riding atop negative news flow. I made a low-ball attempt to buy a call option to play going into earnings, but I did not get a fill. The stock looks poised to rally into Wednesday night’s earnings even with the 50DMA breakdown: buyers have showed up two days in a row just above the $170 level. I may still give the trade a try.
— – —
FOLLOW Dr. Duru’s commentary on financial markets via email, StockTwits, Twitter, and even Instagram!
“Above the 40” uses the percentage of stocks trading above their respective 40-day moving averages (DMAs) to assess the technical health of the stock market and to identify extremes in market sentiment that are likely to reverse. Abbreviated as AT40, Above the 40 is an alternative label for “T2108” which was created by Worden. Learn more about T2108 on my T2108 Resource Page. AT200, or T2107, measures the percentage of stocks trading above their respective 200DMAs.
Active AT40 (T2108) periods: Day #483 over 20%, Day #297 over 30%, Day #97 over 40%, Day #45 over 50%, Day #36 over 60%, Day #3 under 70%
Daily AT40 (T2108)
")
Black line: AT40 (T2108) (% measured on the right)
Red line: Overbought threshold (70%); Blue line: Oversold threshold (20%)
Weekly AT40 (T2108)

*All charts created using freestockcharts.com unless otherwise stated
The charts above are my LATEST updates independent of the date of this given AT40 post. For my latest AT40 post click here.
Related links:
The T2108 Resource Page
You can follow real-time T2108 commentary on twitter using the #T2108 or #AT40 hashtags. T2108-related trades and other trades are occasionally posted on twitter using the #120trade hashtag.
Be careful out there!
Full disclosure: long UVXY calls, long CAT calls, long KBH calls
*Charting notes: FreeStockCharts.com uses midnight U.S. Eastern time as the close for currencies. Stock prices are not adjusted for dividends.
I forgot to note that Trump’s State of the Union speech on Tuesday is yet one more source of potential volatility. At the time of typing, I am selling my UVXY call options as UVXY has surged to 14% on the day.