
AT40 = 70.5% of stocks are trading above their respective 40-day moving averages (DMAs) – Day #1 of an overbought period
AT200 = 66.0% of stocks are trading above their respective 200DMAs (a TEN MONTH HIGH)
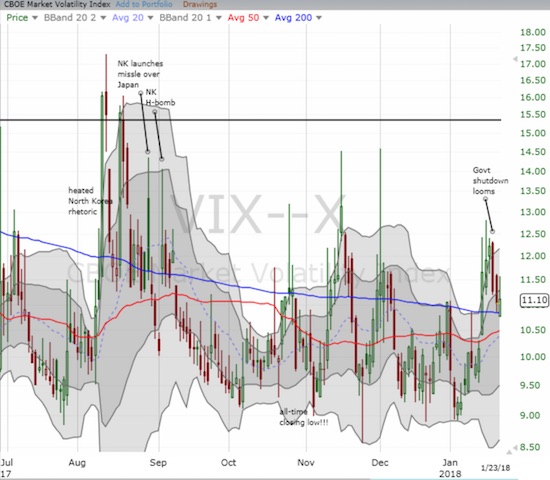
VIX = 11.1
Short-term Trading Call: bullish
Commentary
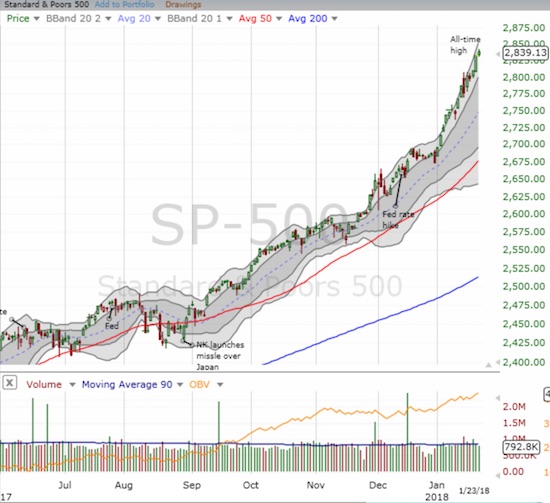
The S&P 500 (SPY) made another all-time high as it continued its remarkable melt-up through its upper-Bollinger Band (BB) channel. The sideline drama of the U.S. government shutdown barely caught the market’s attention; with the can kicked down the road yet again, the market is blithely ignoring the potential for future drama.
I was hoping a continued rally would send volatility a lot lower. The VIX did pullback notably for two trading days but the fade ended abruptly on Tuesday (January 23rd). The ProShares Short VIX Short-Term Futures (SVXY) popped nicely on Monday, but a stall on Tuesday helped to send the value of my SVXY call option careening lower. The prospects for a fresh surge in SVXY this week now look dim.
AT40 (T2108), the percentage of stocks trading above their respective 40-day moving averages (DMAs), is back to cooperating with the bullish signal by powering through the 70% threshold for overbought territory. Perhaps more importantly, AT200 (T2107), the percentage of stocks trading above their respective 200DMAs, closed at a 10-month high. The signals have converged convincingly onto bullish signals.
In the middle of the celebration and the exuberance, I want to point out that AT40 is effectively in unchartered territory. The last time AT40 closed in oversold territory (below 20%) was 480 trading days ago. At that time, I called the end of the oversold period the JP Morgan Bottom. The S&P 500 closed at 1864.78 on that day. The index is up a breathtaking 52.2% since then.
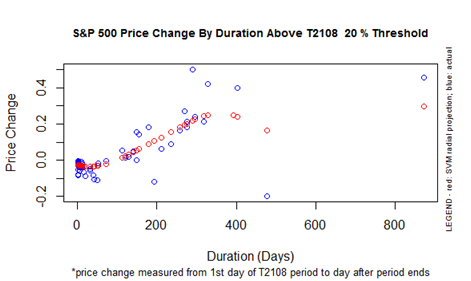
AT40 is experiencing its second longest duration above 20% in my recorded data. My projections of S&P 500 performance based on duration above the 20% threshold mean little at this juncture. The chart suggests a range of 15 to 30%. I cannot imagine the S&P 500 producing more than a garden variety 5% to 10% pullback from current levels (but when was the last time the market even got close to that?). The big question is just how many more weeks and months will this raging bull maintain separation from oversold conditions?
STOCK CHART REVIEWS
M.D.C. Holdings (MDC)
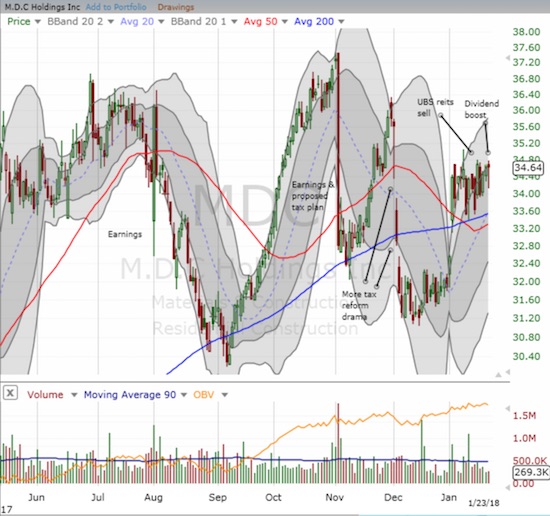
In my Housing Market Review for November, I posted about a buy of home builder M.D.C. Holdings (MDC). Its last earnings happened right as the housing market roiled from tax reform angst. Most home builders have long since left the angst behind, but MDC lags….and thus the buying opportunity on this relatively cheap home builder.
I was further heartened by news that MDC increased its dividend by 20%. This move is a great vote of confidence made even more significant with UBS reiterating a sell rating on MDC (yet raising it price target from $30 to $32).
Earnings are next on February 1st and will deliver a key test of whether the latest dip was just a speedbump. The upside will be large if MDC starts playing catch-up with its peers.
Okta, Inc. (OKTA)
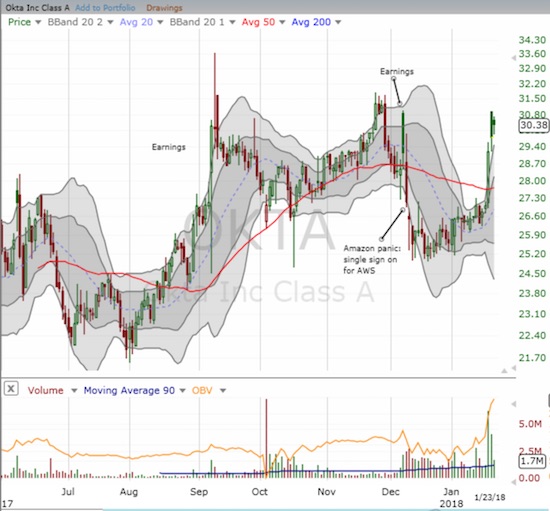
Okta (OKTA) is one of the latest victims of Amazon Panic. I pointed out the buying opportunity a month ago. The stock made little progress from there until a spike out of nowhere on Friday delivered an 8.1% gain and a 50DMA breakout. Seeing no news, I decided to take profits there, especially with the stock closing above its upper-BB. OKTA has now effectively recovered its post-earnings gains from early December.
— – —
FOLLOW Dr. Duru’s commentary on financial markets via email, StockTwits, Twitter, and even Instagram!
“Above the 40” uses the percentage of stocks trading above their respective 40-day moving averages (DMAs) to assess the technical health of the stock market and to identify extremes in market sentiment that are likely to reverse. Abbreviated as AT40, Above the 40 is an alternative label for “T2108” which was created by Worden. Learn more about T2108 on my T2108 Resource Page. AT200, or T2107, measures the percentage of stocks trading above their respective 200DMAs.
Active AT40 (T2108) periods: Day #480 over 20%, Day #294 over 30%, Day #94 over 40%, Day #42 over 50%, Day #33 over 60%, Day #1 over 70% (overbought, ended 5 days under 70%)
Daily AT40 (T2108)
")
Black line: AT40 (T2108) (% measured on the right)
Red line: Overbought threshold (70%); Blue line: Oversold threshold (20%)
Weekly AT40 (T2108)

*All charts created using freestockcharts.com unless otherwise stated
The charts above are my LATEST updates independent of the date of this given AT40 post. For my latest AT40 post click here.
Related links:
The T2108 Resource Page
You can follow real-time T2108 commentary on twitter using the #T2108 or #AT40 hashtags. T2108-related trades and other trades are occasionally posted on twitter using the #120trade hashtag.
Be careful out there!
Full disclosure: long SVXY call, long ULTA shares and calls, long MDC
*Charting notes: FreeStockCharts.com uses midnight U.S. Eastern time as the close for currencies. Stock prices are not adjusted for dividends.