
AT40 = 73.8% of stocks are trading above their respective 40-day moving averages (DMAs) – overbought day #7
AT200 = 59.7% of stocks are trading above their respective 200DMAs
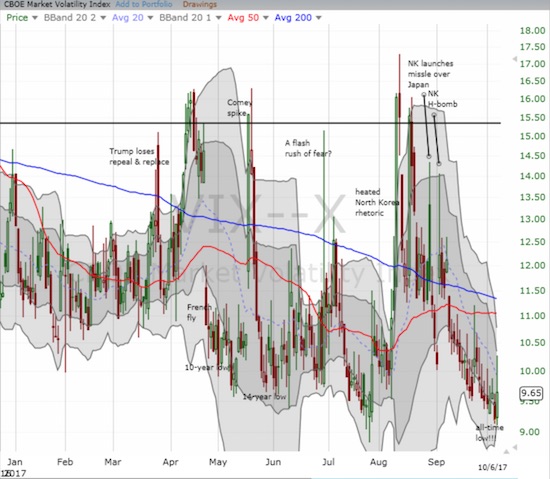
VIX = 9.7
Short-term Trading Call: bullish
Commentary
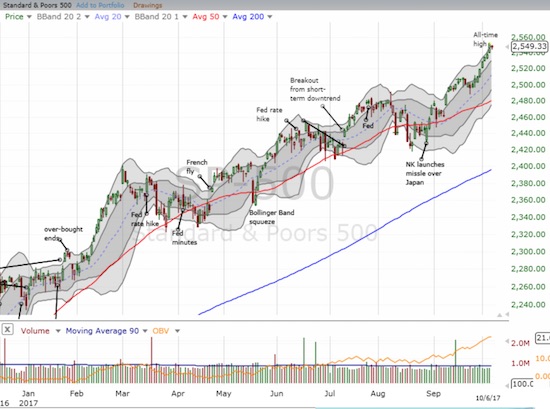
This is what a lift-off for an extended overbought rally looks like.
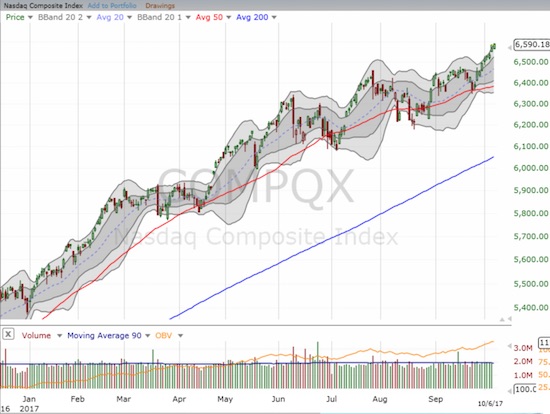
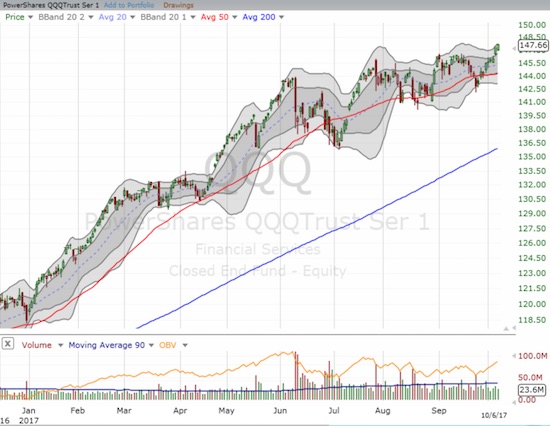
The S&P 500 (SPY) followed its upper-Bollinger Band (BB) the entire week and gained the first 4 days of the week. The NASDAQ followed its upper-BB but gained EACH day of the week (Friday delivered a very marginal gain). The PowerShares QQQ ETF (QQQ) gained each day of the week on its way to tagging its upper-BB the last 2 days of the week.
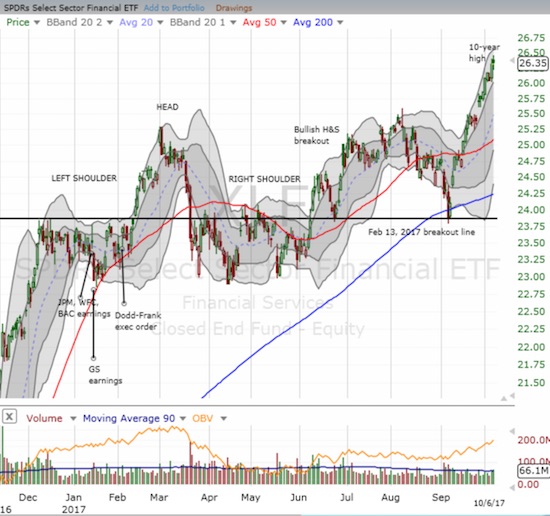
The Financial Select Sector SPDR ETF (XLF) chimed in with its own stretch for the week to a fresh 10-year high.
AT40 (T2108), the percentage of stocks trading above their respective 40DMAs, took a surprising dip on Friday but remained in overbought territory. AT40 closed the week at 73.8%, dropping from 76.9%. This was AT40’s first decline in two weeks. So while AT40 did not end the week confirming the bullish sentiment, the overall trend is still positive. Granted, with another earnings season coming up, there will be plenty of potential catalysts to boot the stock market out of overbought territory.
Interestingly, the volatility index, the VIX, jumped off its all-time low. Perhaps this was a relief rally off “oversold” conditions. Whatever the driver, the end result was quite familiar. The herd of volatility faders managed to push the VIX off its high of 10.3 all the way back to 9.7. The VIX closed with a 5.0% gain.
In trading on the indices, I flipped another round of call options on QQQ. I am still holding onto a tranche of call options on XLF that I bought to start the week. All my trades on the “usual suspects” worked out this week except a small loss I had to take on the week’s Apple (AAPL) call options.
STOCK CHART REVIEWS
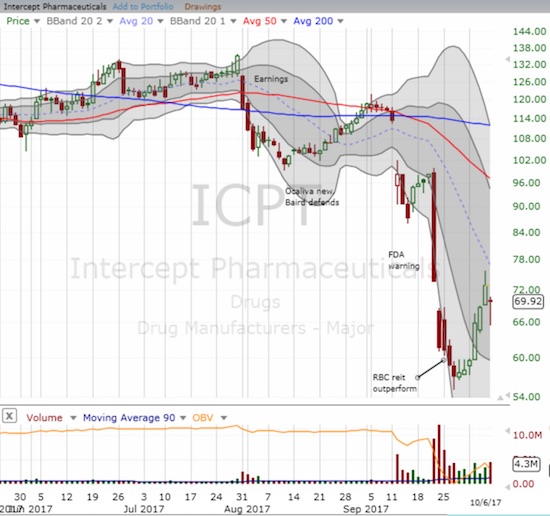
Intercept Pharmaceuticals (ICPT)
I covered my short position in ICPT just in time. Just like that, ICPT gained 20% for the week. ICPT peaked out on Thursday and set up my next trade. After ICPT gapped down sharply from Thursday’s close and traded below Thursday’s low, I opened a fresh short hedged with a call option. ICPT traded another 2 points or so lower before buyers rallied the stock back toward the high of the day. That move put the balance of power back in the hands of the buyers and bulls. The next levels to watch are a breakout above Thursday’s intraday high (bullish) or a close below Friday’s low (bearish). Note on Tuesday I should have BOUGHT ICPT as soon as it opened above Monday’s close as the stock formed a bullish breakout from a small triangle or wedge pattern.
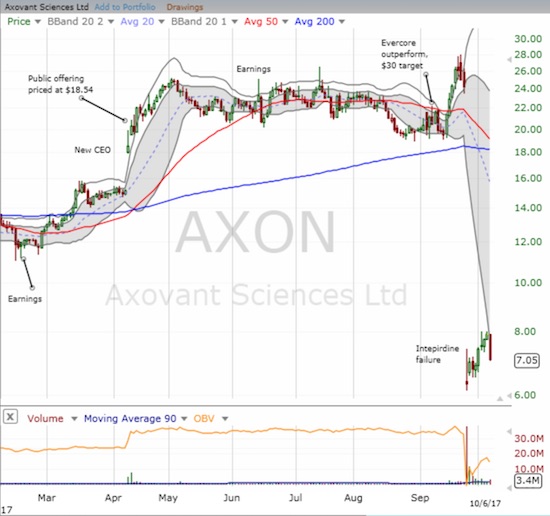
Axovant Sciences (AXON)
After AXON collapsed in late September, I described a fundamental and technical landscape for controlling trades. In this case, AXON failed the initial test. Last week, AXON managed to close at a new post-collapse high and confirmed the move with a higher close. I proceeded to buy a small starter position (earlier than I expected!). Unfortunately, AXON proceeded to lose 11.0% on Friday and closed below the buy threshold of $7.50. The chart below shows how AXON neatly met resistance at its lower-BB.
In cases like these, I continue to hold until/unless the stock cracks a new low below the intraday low that marks the collapse (say below $6.00). If AXON successfully tests its low, I might add to my position.
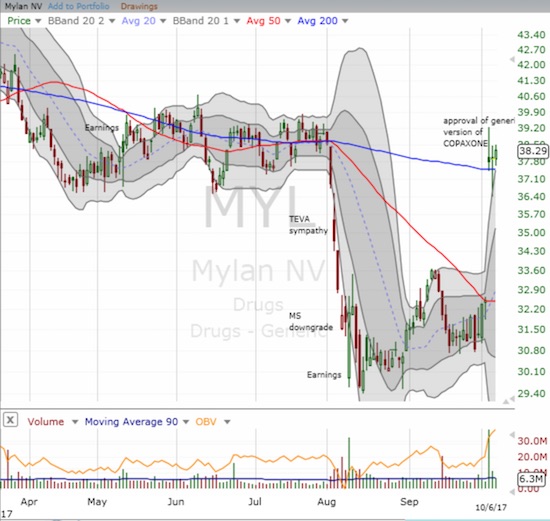
Mylan (MYL)
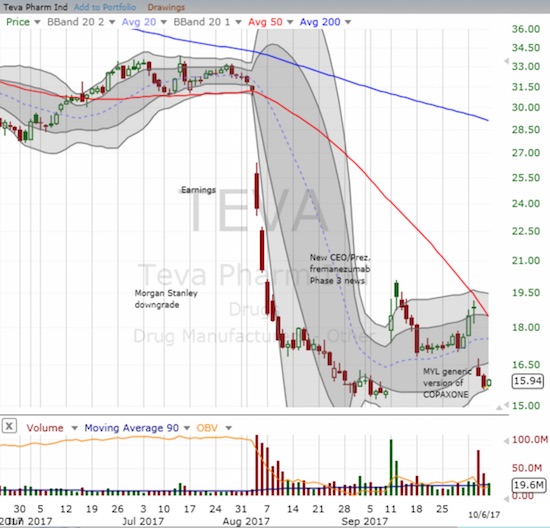
Sticking with the healthcare theme, MYL also had a tremendous week. On Wednesday, MYL gapped above 200DMA resistance for a 16% gain on news of approval of its generic version of COPAXONE. I used this surge as an opportunity to lock in profits on my call options. I originally bought the call options as a counter to MYL’s sell-off in sympathy with Teva Pharmaceuticals (TEVA). I anticipated good news for earnings in two days. However, MYL guided down and the stock gapped down sharply. While MYL rallied immediately, that low of the day barely held during the rest of the month of August. I proceeded to add another call option to my position. In retrospect, I should have been more aggressive, but it was hard to do so after the company’s reduced guidance puts the big 2018 target of $6.00 EPS in question. As a reminder, the CEO gets a nice bonus check if she hits that EPS target by March, 2018.
Teva Pharmaceuticals (TEVA)
Thank goodness I took advantage of TEVA’s first September rally to take profits: MYL returned the sell-off favor to TEVA as TEVA cratered in response to the COPAXONE approval. The stock is now retesting its recent bottom. Sticking with my original trading thesis, I used this sell-off as an opportunity to restart my TEVA trade with a new tranche of call options. According to TEVA, there is an immediate upside opportunity as the company claims MYL’s approval is “at risk.” Per TEVA’s press release:
“Teva Pharmaceutical Industries Ltd. today commented that any launch by Mylan of a generic version of COPAXONE® 40mg/ml (glatiramer acetate) prior to final resolution of the pending patent appeals and other patent litigation should be considered an ‘at-risk’ launch, which could subject Mylan to significant damages among other remedies.”
If TEVA lucks out and switches places with MYL on the stock scales, I will most likely take profits on the TEVA position and get back into MYL.
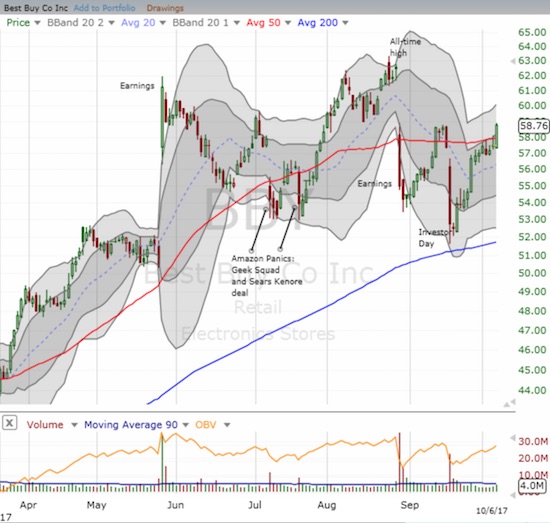
Best Buy (BBY)
In mid-September, I laid out the case for a hedged play on Best Buy (BBY). At the time, I did not even realize the company would be hosting an Investor’s Day the following week. The initial response to that meeting was disastrous as BBY lost 8.0% on the day. I locked in profits on my put options and ended up with a very profitable net trade. The herd must have misinterpreted something from Investor’s Day because BBY has rallied all but 3 days ever since; or maybe technical traders jumped in because of the near test of 200DMA support. Not only has BBY closed the gap down, but also the stock trades right at the previous high. I pulled the trigger on a fresh hedged play, but I fully expect the profits to come from the upside this time and not from a sell-off.
— – —
FOLLOW Dr. Duru’s commentary on financial markets via email, StockTwits, Twitter, and even Instagram!
“Above the 40” uses the percentage of stocks trading above their respective 40-day moving averages (DMAs) to assess the technical health of the stock market and to identify extremes in market sentiment that are likely to reverse. Abbreviated as AT40, Above the 40 is an alternative label for “T2108” which was created by Worden. Learn more about T2108 on my T2108 Resource Page. AT200, or T2107, measures the percentage of stocks trading above their respective 200DMAs.
Active AT40 (T2108) periods: Day #407 over 20%, Day #221 over 30%, Day #21 over 40%, Day #20 over 50%, Day #16 over 60%, Day #7 over 70% (overbought)
Daily AT40 (T2108)
")
Black line: AT40 (T2108) (% measured on the right)
Red line: Overbought threshold (70%); Blue line: Oversold threshold (20%)
Weekly AT40 (T2108)

*All charts created using freestockcharts.com unless otherwise stated
The charts above are my LATEST updates independent of the date of this given AT40 post. For my latest AT40 post click here.
Related links:
The T2108 Resource Page
You can follow real-time T2108 commentary on twitter using the #T2108 or #AT40 hashtags. T2108-related trades and other trades are occasionally posted on twitter using the #120trade hashtag.
Be careful out there!
Full disclosure: short ICPT, long ICPT call option, long TEVA call options, long XLF call options, long AXON
*Charting notes: FreeStockCharts.com uses midnight U.S. Eastern time as the close for currencies. Stock prices are not adjusted for dividends.