
AT40 = 46.5% of stocks are trading above their respective 40-day moving averages (DMAs)
AT200 = 61.8% of stocks are trading above their respective 200DMAs
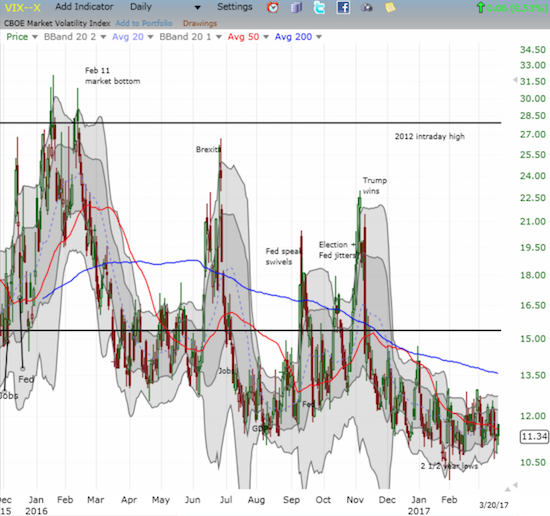
VIX = 11.3 (volatility index)
Short-term Trading Call: neutral
Commentary
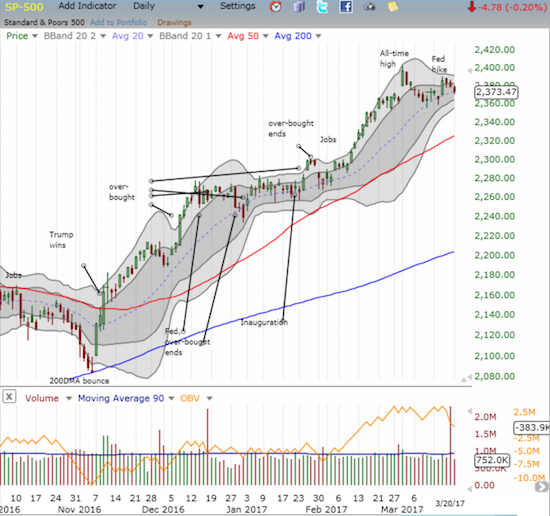
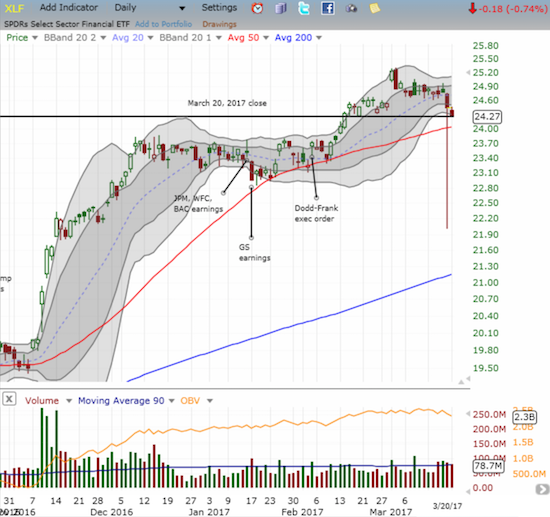
In my last Above the 40, I pointed out a surprising and mild bullish divergence. Like so much else in this market, follow-through failed to materialize on Monday. The S&P 500 (SPY) continued its traditional post-Fed fade by trickling downward 0.2%. The low of the day essentially completed the reversal of last week’s post-Fed celebration. Financials under-performed with a 0.7% loss for the Financial Select Sector SPDR ETF (XLF) that set a new 5-week low, confirmed the end of the bullish March 1st breakout, put into play support at the 50-day moving average (DMA), AND now threatens to erase the big breakout from mid-February. AT40 (T2108) quickly returned to its weak showing. Its drop from 50.3% to 46.5% underlined the stock market’s desire to return to its regularly scheduled program of technical “droopiness.”
The volatility index, the VIX, still sits in extreme lows. Its day-to-day moves provide few clues. If trouble descends upon this market anytime soon, the angst will likely be sharp, sudden, and abrupt.
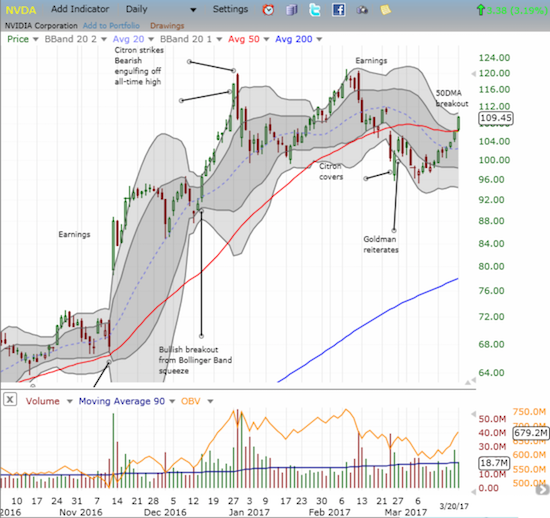
While the stock market reminded me again of the wobbly technical underpinnings, there were some notable gainers on the day. One of the more notable was NVIDIA (NVDA). The stock broke out above its 50DMA resistance in a very bullish move that firmly vindicated Goldman Sachs (GS) on its move to reiterate its call on NVDA. Look out if NVDA hurdles $112; that level was the scene of NVDA’s last top which hit right at its 20DMA at the time.
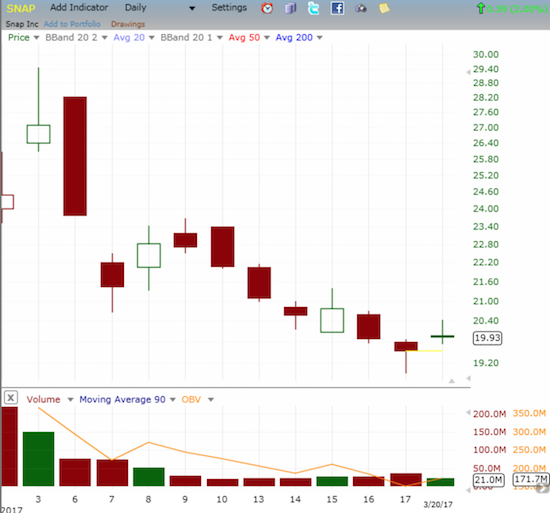
Snap Inc. (SNAP) once again demonstrated the importance of analyst commentary for a young stock. After 12 days of trading, a brave analyst FINALLY came out with a buy recommendation on SNAP. From Barron’s:
“James Cakmak of Monness, Crespi, Hardt, and Co. initiated coverage of Snap on Monday with a price target of $25…
‘We see two ways to succeed in mobile video: serve as an outright destination or offer a differentiated experience…The former we consider won by YouTube, but the latter is an open field where Snap has an edge.'”
The stock closed up with a 2.0% gain and LOOKS like it is trying to bottom. Friday’s drop to as low as $18.90 produced a hammer-like pattern which marks potential bottoms. Technically, SNAP’s gap up and close higher on Monday confirmed that bottom. However, given the stock’s volatility, a close above Thursday’s high at $20.69 would provide a more solid foundation for a bottom. The stop is a close at a new all-time low.
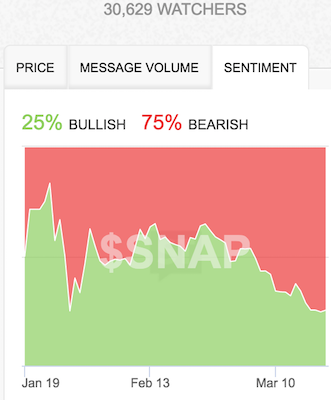
Source: StockTwits.com
— – —
FOLLOW Dr. Duru’s commentary on financial markets via email, StockTwits, Twitter, and even Instagram!
“Above the 40” uses the percentage of stocks trading above their respective 40-day moving averages (DMAs) to assess the technical health of the stock market and to identify extremes in market sentiment that are likely to reverse. Abbreviated as AT40, Above the 40 is an alternative label for “T2108” which was created by Worden. Learn more about T2108 on my T2108 Resource Page. AT200, or T2107, measures the percentage of stocks trading above their respective 200DMAs.
Active AT40 (T2108) periods: Day #272 over 20%, Day #92 over 30%, Day #4 over 40% (overperiod), Day #1 under 50% (underperiod ending 1 day over 50%), Day #13 under 60%, Day #44 under 70%
Daily AT40 (T2108)
")
Black line: AT40 (T2108) (% measured on the right)
Red line: Overbought threshold (70%); Blue line: Oversold threshold (20%)
Weekly AT40 (T2108)

*All charts created using freestockcharts.com unless otherwise stated
The charts above are my LATEST updates independent of the date of this given AT40 post. For my latest AT40 post click here.
Related links:
The T2108 Resource Page
You can follow real-time T2108 commentary on twitter using the #T2108 or #AT40 hashtags. T2108-related trades and other trades are occasionally posted on twitter using the #120trade hashtag.
Be careful out there!
Full disclosure: long NVDA shares and call spread, long SNAP