
(T2108 measures the percentage of stocks trading above their respective 40-day moving averages [DMAs]. It helps to identify extremes in market sentiment that are likely to reverse. To learn more about it, see my T2108 Resource Page. You can follow real-time T2108 commentary on twitter using the #T2108 hashtag. T2108-related trades and other trades are occasionally posted on twitter using the #120trade hashtag. T2107 measures the percentage of stocks trading above their respective 200DMAs)
T2108 Status: 64.5%
T2107 Status: 63.5%
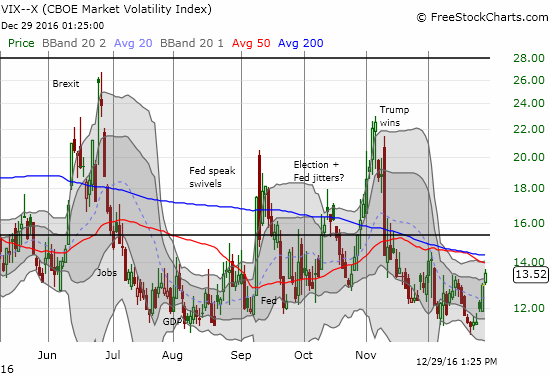
VIX Status: 13.5
General (Short-term) Trading Call: cautiously bearish
Active T2108 periods: Day #217 over 20%, Day #37 over 30%, Day #36 over 40%, Day #34 over 50%, Day #28 over 60% (overperiod), Day #3 under 70% (underperiod)
Commentary
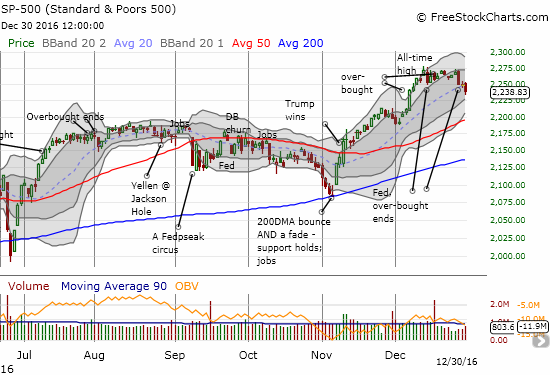
The S&P 500 (SPY) ended 2016 by following through on the bearish trading signals I identified in the last T2108 Update. Today’s 0.5% loss came on slightly higher volume and on an additional push higher in the volatility index, the VIX. T2108, the percentage of stocks trading above their respective 50-day moving averages (DMAs) dropped to 64.5%.
The NASDAQ (QQQ) delivered an even more convincing loss on the day. The tech-laden index’s 0.9% drop confirmed the end of the previous (short) consolidation period.
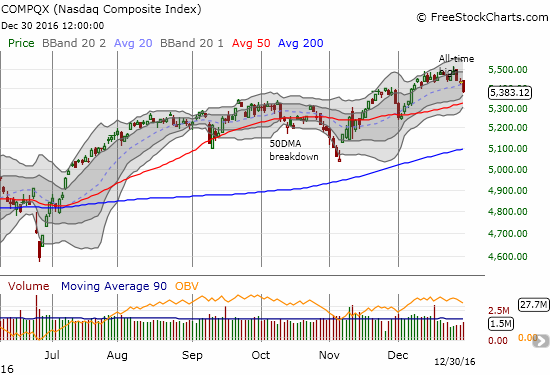
Note that both major indices broke through primary uptrends represented by their respective 20DMAs.
Interestingly, several other important signals held their ground right at the edge of additional bearish confirmations.
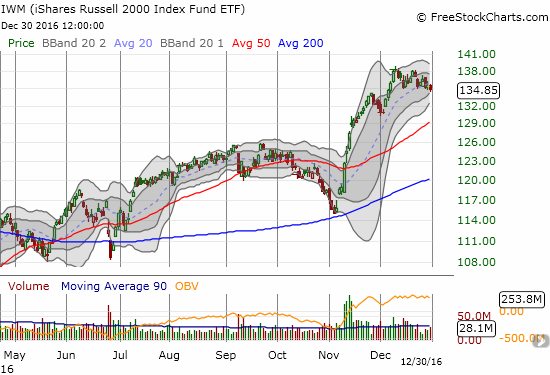
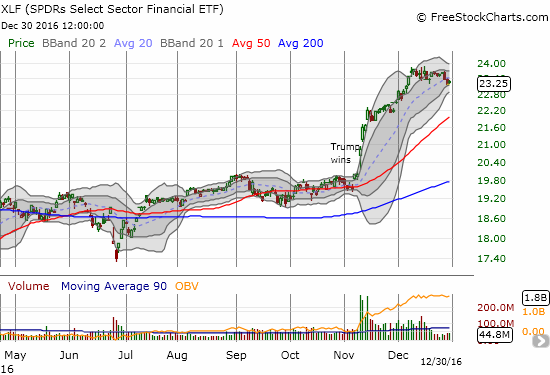
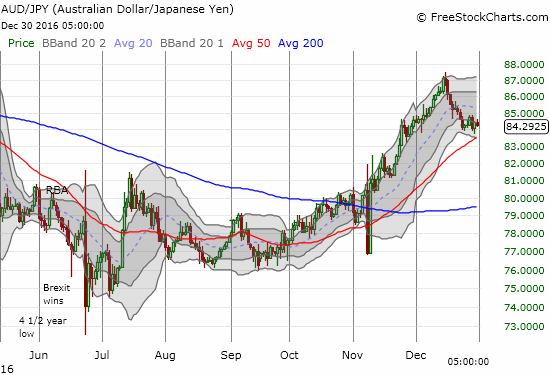
The iShares Russell 2000 (IWM) topped out three weeks ago, but it is still barely clinging to the bottom of its consolidation range. The Financial Select Sector SPDR ETF (XLF) managed to stay flat a day after finishing a reversal of its last breakout. The previous day, XLF also traded below its primary trend at the 20DMA for the first time since November 4th. The Australian dollar (FXA) versus the Japanese yen (FXY) marked a sixth day in a consolidation pattern that abruptly ended a sharp slide from the most recent high. AUD/JPY’s 50DMA is rushing upward to attempt a delivery of support.
These collective signals set up the first week of 2017 as an extremely important test of buying interest.
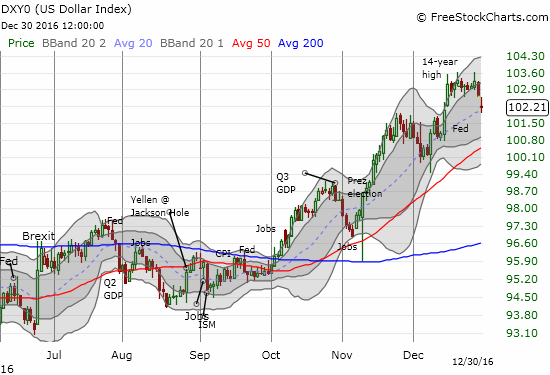
Even the U.S. dollar index (DXY0) is stepping into 2017 with a hint of caution. Post-Fed the dollar printed two straight strong days to a new 14-year high. The dollar failed to make any further progress for two weeks. It ended 2016 with two days of selling that neatly reversed half its post-Fed gain and a near erasure of the last breakout.
There is a freshly interesting dichotomy between the low volatility and high beta components of the S&P 500. The PowerShares S&P 500 Low Volatility ETF (SPLV) has held its ground since first selling off in the wake of the U.S. Federal Reserve’s latest pronouncements on monetary policy. SPLV is in a small consolidation pattern and is holding support at its 50 and 200DMAs. The PowerShares S&P 500 High Beta ETF (SPHB) last topped out on December 9th. The Fed slightly greased the skids, but the confirmation selling did not arrive until this week. As a reminder, the S&P 500 generally tends to perform better when SPHB is rallying AND is out-performing SPLV. The S&P 500 generally tends to perform worse when SPHB is in decline and especially when it is under-performing SPLV. The ratio of SPHB/SPLV is currently in decline.
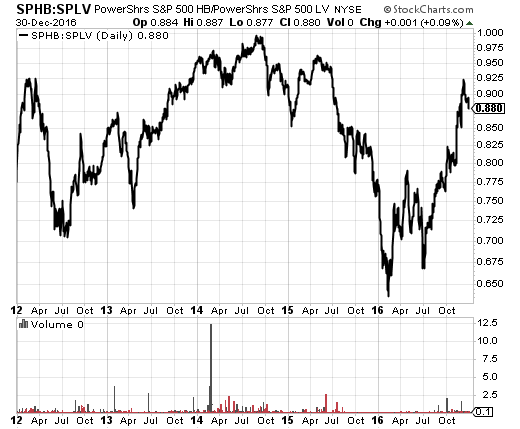
Source: StockCharts.com
All things considered, I left my short-term trading call at cautiously bearish.
I am ending another year of T2108 Updates with some brief follow-ups.
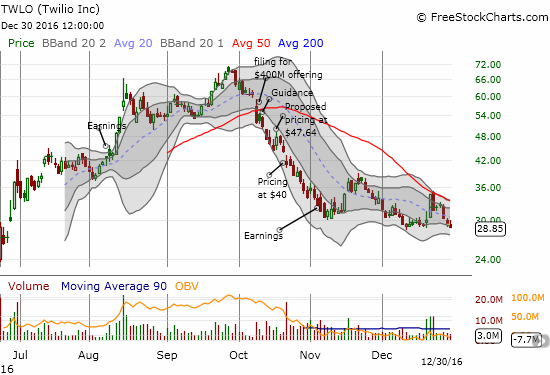
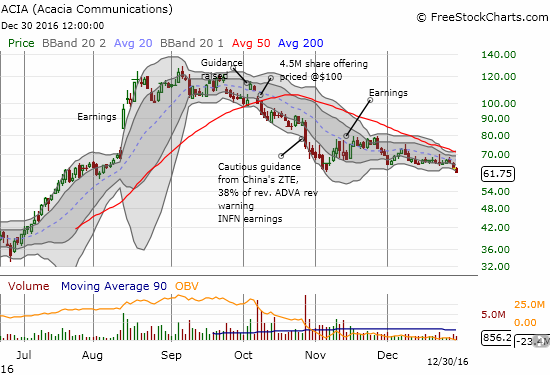
Two months ago, I wrote “Awful Offerings: Acacia Communications and Twilio.” I noted the poor market response to the companies after they each returned to the till to extract additional funds from the stock market. I held out earnings as an important to test to see whether the companies could reignite excitement in their respective stocks. Both companies failed to deliver. While both TWLO and ACIA experienced some bouts of interest after reporting earnings, both stocks closed 2016 at new post-earnings lows. The two stocks also share precarious technicals with their respective 50DMAs carving out well-defined and declining resistance levels.
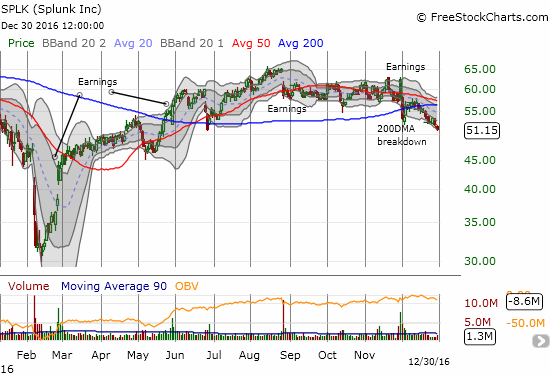
Another chart that has my interest is Splunk (SPLK). At the beginning of December, I noted how SPLNK’s post-earnings chart printed an ominous bearish pattern.
$SPLK post-earnings "gap and crap" has now become a 200DMA breakdown. Trading volumes still high. On watch. pic.twitter.com/5pmk4ILbM6
— Dr. Duru (@DrDuru) December 1, 2016
SPLK managed to bounce right back after that gap and crap, but it never generated much altitude above its 200DMA. SPLK closed the year at a new post-earnings low that confirmed the second 200DMA breakdown.
For one somewhat positive follow-up I offer Cheesecake Factory (CAKE). I have stalked this stock since I noted its bullish post-election surge in mid-November. CAKE never did fall back to my preferred support level, and I should have jumped right into the pool after noticing the water was going to stay warm. Instead, I watched as CAKE soared to additional all-time highs. A limit order I placed along the way for call options finally triggered on the last day of the year just as CAKE returned to that first post-election all-time high…
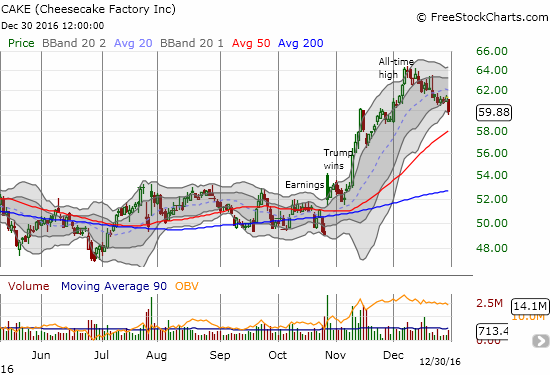
I made a rare exception from my short-term trading call for CAKE. However, if the market starts 2017 with more confirmation of the current bearish signals, I doubt CAKE will be able to weather the storm with any kind of out-performance.
Here is to a prosperous New Year no matter how and where the winds blow…
— – —
FOLLOW Dr. Duru’s commentary on financial markets via email, StockTwits, Twitter, and even Instagram!
Daily T2108 vs the S&P 500
")
Black line: T2108 (measured on the right); Green line: S&P 500 (for comparative purposes)
Red line: T2108 Overbought (70%); Blue line: T2108 Oversold (20%)
Weekly T2108

*All charts created using freestockcharts.com unless otherwise stated
The charts above are the my LATEST updates independent of the date of this given T2108 post. For my latest T2108 post click here.
Related links:
The T2108 Resource Page
Be careful out there!
Full disclosure: long SDS, short AUD/JPY, long CAKE call options