
(T2108 measures the percentage of stocks trading above their respective 40-day moving averages [DMAs]. It helps to identify extremes in market sentiment that are likely to reverse. To learn more about it, see my T2108 Resource Page. You can follow real-time T2108 commentary on twitter using the #T2108 hashtag. T2108-related trades and other trades are occasionally posted on twitter using the #120trade hashtag. T2107 measures the percentage of stocks trading above their respective 200DMAs)
T2108 Status: 50.1%
T2107 Status: 71.4%
VIX Status: 13.3
General (Short-term) Trading Call: neutral
Active T2108 periods: Day #156 over 20%, Day #12 over 30%, Day #6 over 40%, Day #1 over 50% (overperiod, ending 1 day under 50%), Day #16 under 60% (underperiod), Day #42 under 70%
Commentary
The S&P 500 (SPY) ended the week about the same place where it ended the previous week. The index even ended the month of September almost exactly where it ended the previous month of August. In between both bookends the S&P 500 experienced major churn and the occasional bout of heartburn. The Federal Reserve and FedSpeak was a dominant theme that in the final week took a (temporary) backseat to the screaming headlines about the troubles at Deutsche Bank (DB).
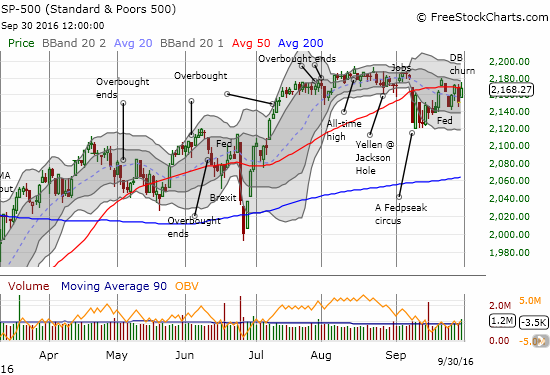
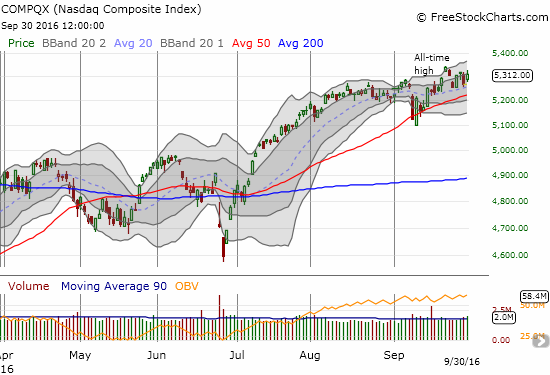
Note in the chart above how the 50DMA is currently holding as approximate resistance. While the S&P 500 struggles to recapture former glory, the tech-laden NASDAQ (QQQ) managed to notch new all-time highs. The 50DMA for the NASDAQ has a definitive uptrend that is guiding the index ever higher and providing support. The NASDAQ gained a whopping 9.7% in the third quarter. The S&P 500 “only” managed a 3.3% gain over that same period. Either way, the post-Brexit trading action demonstrated the power of violently shaking motivated sellers out of the market.
T2108, the percentage of stocks trading above their respective 40-day moving averages (DMAs) bounced right along with the stock market. T2108’s action confirms the message of the S&P 500 and fails to confirm the message of the NASDAQ. At its low point in the current cycle, T2108 closed marginally lower than its post-Brexit low, levels not seen since the heartburn of February. Just as with the post-Brexit episode, the 20s proved “close enough” to oversold to fuel the next bounce. The churning seas since that bounce have sent T2108 soaring and plunging on alternating days. T2108 closed the month at a very neutral 50.1%.
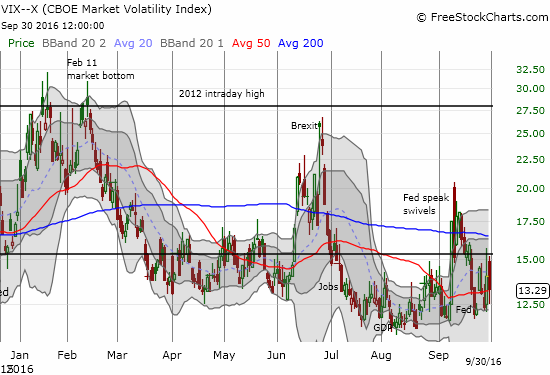
The volatility index, the VIX, experienced its own violent swings in September. Each spike higher was a fresh chance to fade volatility. This strategy dominated my thinking and trading through the month. As usual, the 15.35 pivot strongly defined the VIX’s action. Ever since the Fed helped shove the VIX off its last spike higher, the VIX has failed to close above the pivot. The VIX closed the month at 13.3, just above its “launching pad” of around 12, a level that the VIX tends to reject eventually.
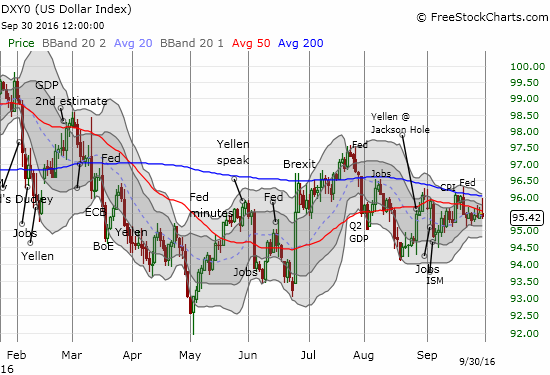
The dollar index (DXY0) experienced its own churn in September. The index’s 50 and 200DMAs have tightly capped the trading action. A breakout/down from the current congestion could launch a major move in the dollar.
As we leave behind a month and a quarter of major churn, it is natural to expect more of the same in the coming quarter given the big looming events of the U.S. Presidential election and a likely rate hike from the Fed in December. My bias still leans toward fading volatility when spikes coincide with screaming headlines. I am keeping a base number of shares in ProShares Ultra VIX Short-Term Futures (UVXY) that serve as the starting point for selling calls and buying puts.
Deutsche Bank (DB) is a fascinating case of what can happen in an over-crowded trade, especially on the bearish side. The chart below was posted on StockTwits on September 29, 2016, and it should tell you everything you need to know about the powderkeg sitting underneath DB shares.
Source: StockTwits
The current surge in open interest for put options is eye-popping. So no surprise that when a little bit of good news came out on Friday about DB the stock soared 14.0%.
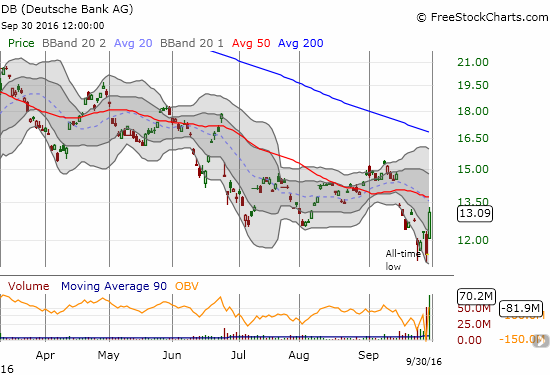
I currently hold call options on DB. After seeing how crowded the bear trade is, I decided to hold onto the call options to see whether the contrarian/relief bounce can continue for additional large gains. Based on the extreme in negative sentiment and the likelihood that Germany will be forced to bail out DB if necessary, I am not looking to join the bearish hoards to fade whatever rally ensues.
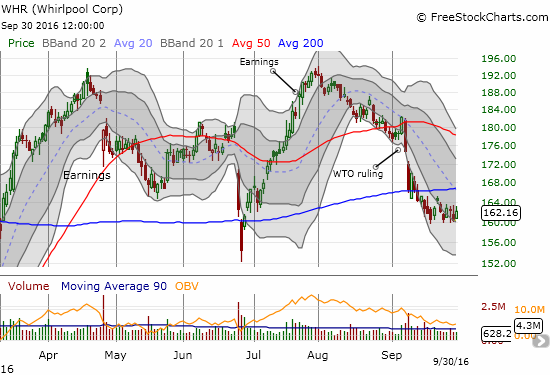
Whirlpool (WHR) has churned in a tight range since it broke down below 200DMA support two weeks ago. I made a bet that October will deliver a continuation downward.
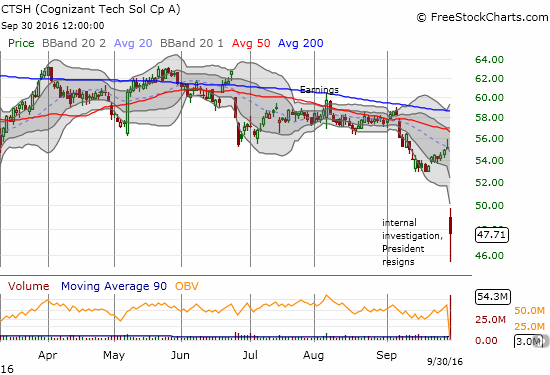
Almost two months ago I marveled at the ability of Cognizant Technology (CTSH) to bounce back from a poor earnings report. It was a time when it seemed buyers were automatically buying any dip for any reason in a swath of individual stocks. Turns out I should have stuck with the short side.
On Friday, traders slammed CTSH in the wake of news of an internal investigation and the abrupt resignation of the company’s president. CTSH lost 13.3% on the day as buyers managed to pick the stock up over two points from the low of the day.
A mixed analyst response probably helps explain the ability of CTSH to lift off its lows. It will likely hold that low and churn until the news takes on more shape. Argus cut CTSH to hold. Citigroup dropped CTSH to neutral. HSBC actually initiated CTSH with a buy although that rating may have come without knowledge of the CTSH revelations. Needham & Company kept its buy rating and $68 price target and probably best expressed the optimistic side of the trade:
“Given the early stage and scarcity of detail on the payments investigation, it does not currently alter our forward-looking view of the stock, but we will continue to monitor the situation. We attribute the fall in the stock today more to the investigation than the resignation itself, though investors may be concerned that the two events are related.”
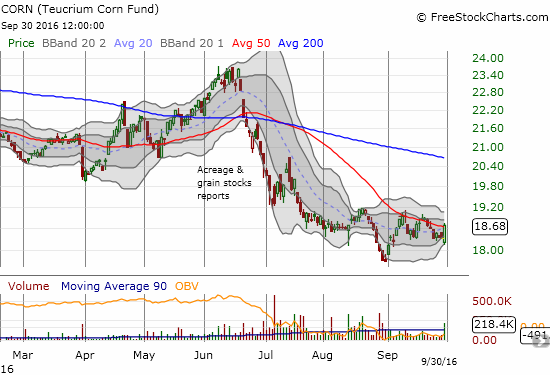
Two weeks ago I bought put options on Teucrium Corn ETF (CORN) as a play on 50DMA resistance. Even with a second test of resistance, the trade looked OK until Friday. CORN gapped down only to end the day with a 1.9% gain on high volume. This move formed a bullish engulfing pattern that is often the mark of a bottom. This bottom gets confirmed if CORN closes above $19.20/share which would clear a lot of resistance. For now, CORN is stuck at 50DMA resistance.
— – —
FOLLOW Dr. Duru’s commentary on financial markets via email, StockTwits, Twitter, and even Instagram!
Daily T2108 vs the S&P 500
")
Black line: T2108 (measured on the right); Green line: S&P 500 (for comparative purposes)
Red line: T2108 Overbought (70%); Blue line: T2108 Oversold (20%)
Weekly T2108

*All charts created using freestockcharts.com unless otherwise stated
The charts above are the my LATEST updates independent of the date of this given T2108 post. For my latest T2108 post click here.
Related links:
The T2108 Resource Page
Be careful out there!
Full disclosure: long SDS, long UVXY shares, long WHR puts, long CORN puts
Great job on charts helps alot.
Thanks for the feedback!