
(T2108 measures the percentage of stocks trading above their respective 40-day moving averages [DMAs]. It helps to identify extremes in market sentiment that are likely to reverse. To learn more about it, see my T2108 Resource Page. You can follow real-time T2108 commentary on twitter using the #T2108 hashtag. T2108-related trades and other trades are occasionally posted on twitter using the #120trade hashtag. T2107 measures the percentage of stocks trading above their respective 200DMAs)
T2108 Status: 59.9%
T2107 Status: 67.2%
VIX Status: 13.4
General (Short-term) Trading Call: bearish
Active T2108 periods: Day #119 over 20%, Day #25 over 30%, Day #24 over 40%, Day #23 over 50% (overperiod), Day #1 under 60% (ending 17 days over 60%) (underperiod), Day #2 under 70%
Commentary

The bears perked up before the bulls. The S&P 500 (SPY) finally broke down today. I am sure the move got a lot of attention, especially from the bears, because of the suggestive visual.
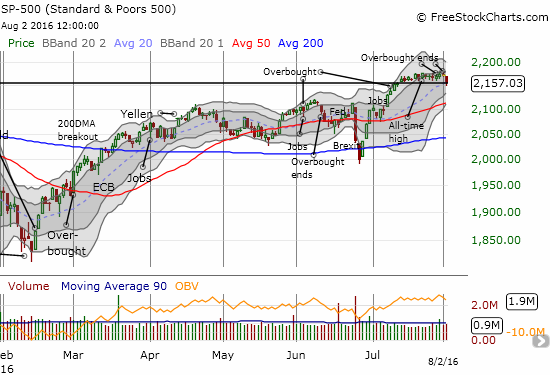
While buyers managed to close out the index a hair’s length above the bottom of the trading range (see the thick black horizontal line in the above chart), I still consider this move a confirming breakdown. It is “close enough” particularly because T2108 slipped down so far with a close of 59.9%. Note that yesterday’s bearish divergence and T2108’s drop out of overbought conditions presaged the index’s breakdown. Accordingly, I have shifted the short-term trading call from cautiously bearish to bearish. This change means I completely stop looking for buying opportunities and focus on short opportunities. Per my plan, the index’s breakdown triggered a purchase of put options on ProShares Ultra S&P500 (SSO). I chose a September expiration to give plenty of time for bears to shake out the most aggressive bulls who have been buying every minute dip for the past two weeks. (I sat on my SPY call options as they dropped so much in value to make them worth more as a hedge than a truncated loss).
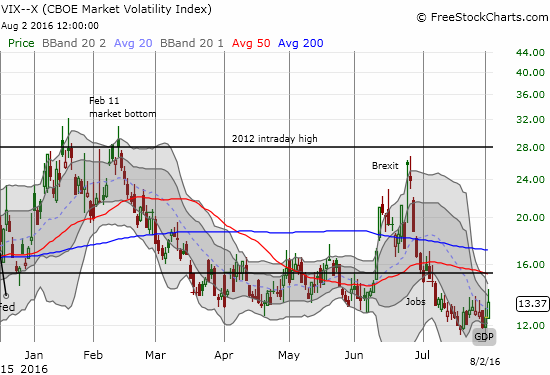
The volatility index, the VIX, printed a second day of gains but still could not close above the recent intraday highs. This failure surprised me given the ominous nature of the index’s breakdown.
Apple (AAPL) was one of the more notable casualties on the day. The stock is still above 200DMA support, but it reversed all of its impressive gains from the previous day. This turned a confirmed 200DMA breakout into a much more questionable one. Needless to say, I quickly sold my calls per plan soon after the open proved the day would likely be rough for AAPL.
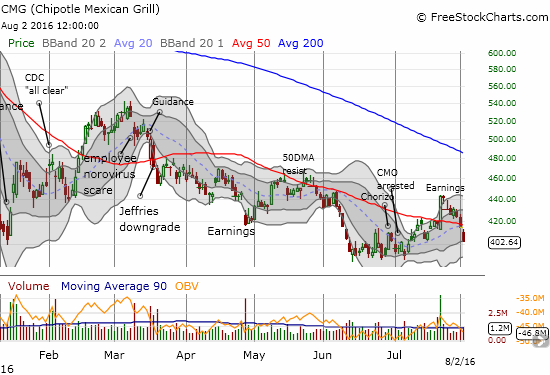
Chipotle Mexican Grill (CMG) also stood out as sellers turned out in volume for a second straight day. The 1-day post-earnings recovery is a distant memory now. I failed to mention my latest trade in the last T2108 Update, but hopefully those who are interested know the drill from my discussion of the technicals after CMG reported earnings and earlier observations of CMG’s volatile behavior. Yesterday, I bought a small number of shares and a put option with the intention of playing the next sudden burst in the stock. CMG delivered with a 2.8% loss that confirmed its 50DMA breakdown. I managed the position a little more closely this time around by stopping out of the shares and then riding the put option for a few more points lower. This fortuitous combination stretched out my profits. The breakdown, combined with my bearish trading bias, means that future CMG trades may consist of just put options. Stay tuned.
Tumbling stocks in retailers, auto, and travel caught my particular attention today.
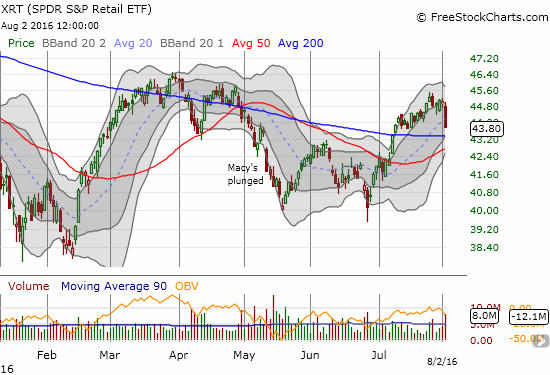
Retailers took a major hit. The post-Brexit recovery rally in SPDR S&P Retail ETF (XRT) looks like it is over. However, can converging support at the 50 and 200DMAs hold? I am betting that they both eventually fail. Macy’s (M) is a good example of the technical damage that occurred to individual retailers. On July 26th, Macy’s made a valiant effort in closing the huge May post-earnings gap down. Today’s fresh 50DMA breakdown on high volume makes it very likely post-earnings selling is ready to resume. August 11th earnings will be an important performance marker.
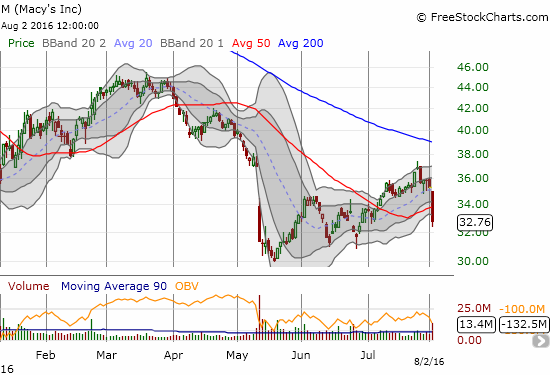
Macy’s lost a whopping 7.3% on the day. Other department stores like Nordstrom (JWN) with a 6.9% decline lost big as well. Skechers (SKX) saw a major and bearish extension of post-earnings selling with a 3.9% loss on the day. My previous bullish bias got me into the “value play” too early.
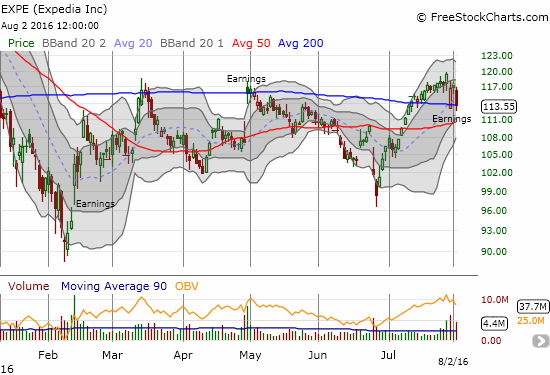
Last week, Expedia (EXPE) put on an impressive post-earnings recovery that almost reversed the entire gap down. Today reversed all those gains. Buyers barely managed to get a close at 200DMA support. Given the re-appearance of high-volume selling, I doubt the support will hold. I will fade any bounce in anticipation of that support eventually failing.
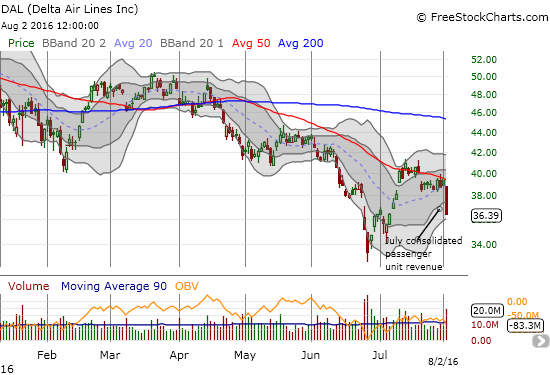
Delta Airlines (DAL) ran into trouble with its July report on passenger revenue. I noticed that Delta claimed the numbers were exactly as they expected. So, the depths of the selling surprised me; if I were bullish, I might be looking to buy this dip. Instead, I am noting that the high-volume selling confirmed 50DMA resistance. DAL is now down a whopping 28% year-to-date. With oil prices tumbling again, I have to resist the urge to think of the selling in DAL as a buying opportunity for now. On a technical basis, DAL is one to fade in a bearish market on any rallies up to the 50DMA.
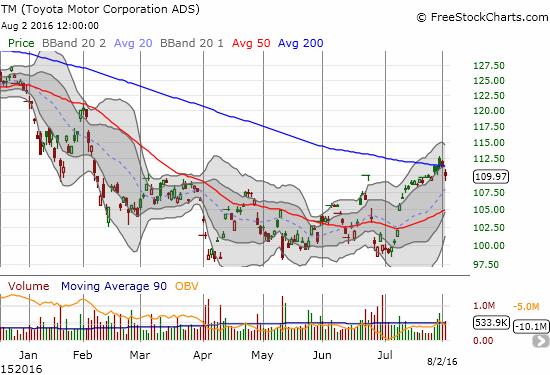
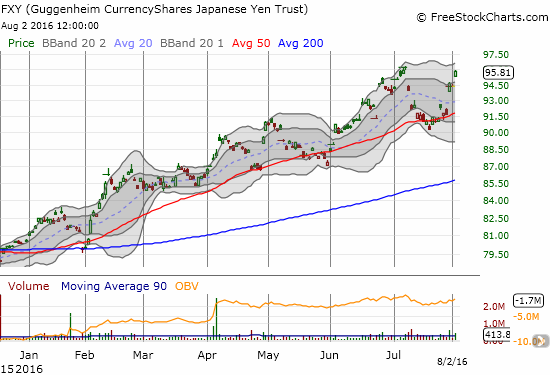
Last week, Ford Motor (F) gapped down significantly. At the time, I did not think about sympathy trades. However, Toyota Motor (TM) now looks like a juicy target with the stock gapping down below 200DMA support today. Moreover, the Japanese yen (FXY) is back in a strengthening phase and should hamper TM’s performance. Even though TM manufactures a lot of its North American fleet in the U.S. and Mexico, whatever gets exported from Japan will suffer from yen appreciation.
Per plan, I accumulated more puts on FXY. As I watched FXY continue drifting upward, it suddenly occurred to me that I should not get overly confident on finding a second resounding success in playing a failure for USD/JPY to break below 100. If 100 does fail, the subsequent strengthening in the yen could be swift. So, I decided to turn FXY into a hedged play. I bought a single call option to start, so I am still very overweighted on put options.
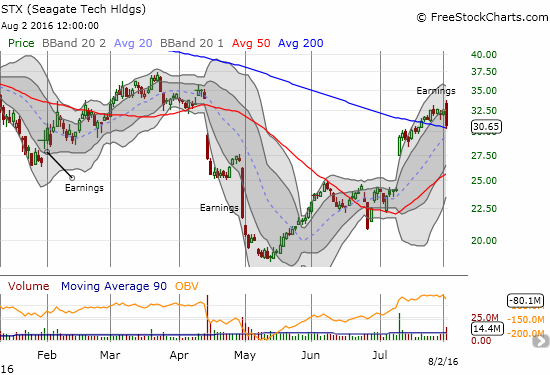
On the high-tech side, Seagate (STX) was one of several stocks catching my attention. STX made an impressive recovery from April and May’s selling and continued the recovery with a post-earnings gap up. Sellers took over from there and created an ominous bearish engulfing pattern. It seems STX suffered the consequences of a change in trading tone in the market. Note that the stock closed just short of 200DMA support. A failure of support will immediately put the 50DMA support in play.
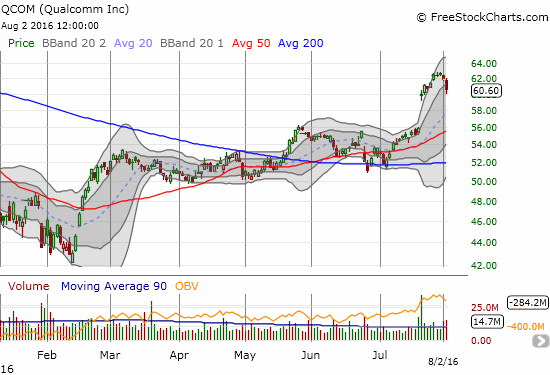
Even Qualcomm (QCOM) is feeling the pressure. The company delivered a major surprise in earnings two weeks ago and gapped up 7.4%. The incremental gains from there have now reversed. When the market signal turns bullish again at some point, QCOM will be at the top of my list given the strength it exhibits now.
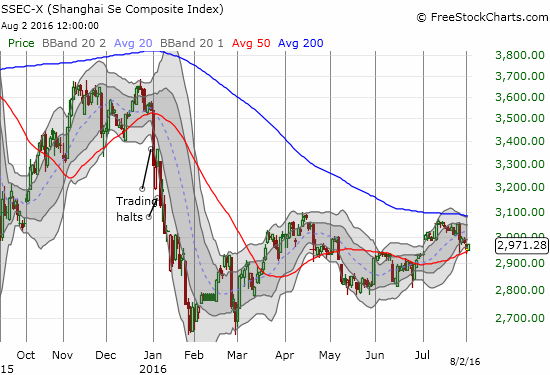
I have not looked at the Shanghai Composite (SSEC) in quite some time. Amazingly, the Chinese government has succeeded in significantly calming the market – granted the index remains well-below its earlier stratospheric highs. Still, SSEC no longer causes markets over here any concern.
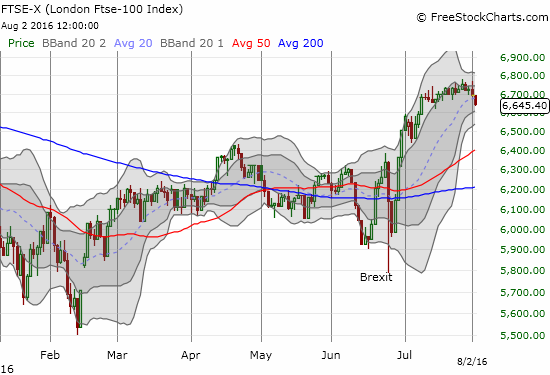
The FTSE100, an index of the United Kingdom’s 100 largest companies, has finally stalled out after benefiting from the post-Brexit selling in the British pound (FXB). The index managed to gain over 10% at one point! The index now looks like it is waiting for judgement from this week’s Inflation Report from the Bank of England.
— – —
Reference Charts (click for view of last 6 months from Stockcharts.com):
S&P 500 or SPY
U.S. Dollar Index (U.S. dollar)
EEM (iShares MSCI Emerging Markets)
VIX (volatility index)
VXX (iPath S&P 500 VIX Short-Term Futures ETN)
EWG (iShares MSCI Germany Index Fund)
CAT (Caterpillar).
IBB (iShares Nasdaq Biotechnology).
Daily T2108 vs the S&P 500
")
Black line: T2108 (measured on the right); Green line: S&P 500 (for comparative purposes)
Red line: T2108 Overbought (70%); Blue line: T2108 Oversold (20%)
Weekly T2108

*All charts created using freestockcharts.com unless otherwise stated
The charts above are the my LATEST updates independent of the date of this given T2108 post. For my latest T2108 post click here.
Related links:
The T2108 Resource Page
Be careful out there!
Full disclosure: long SSO put options, long SPY call options, long UVXY shares, long XRT put options, long FXY calls and puts, net short the Japanese yen in forex, long SKX call options