(T2108 measures the percentage of stocks trading above their respective 40-day moving averages [DMAs]. It helps to identify extremes in market sentiment that are likely to reverse. To learn more about it, see my T2108 Resource Page. You can follow real-time T2108 commentary on twitter using the #T2108 hashtag. T2108-related trades and other trades are occasionally posted on twitter using the #120trade hashtag. T2107 measures the percentage of stocks trading above their respective 200DMAs)
T2108 Status: 56.7%
T2107 Status: 63.9%
VIX Status: 21.2
General (Short-term) Trading Call: bearish
Active T2108 periods: Day #91 over 20%, Day #90 over 30%, Day #87 over 40%, Day #2 over 50%, Day #2 under 60%, Day #9 under 70%
Commentary
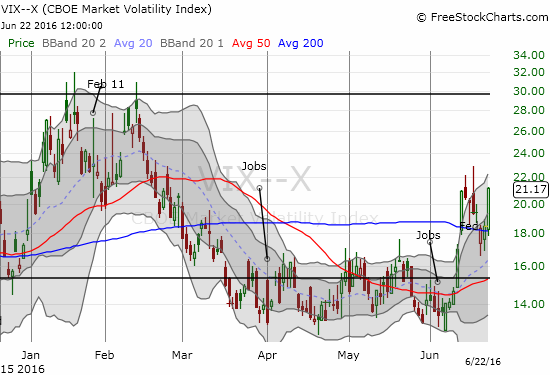
At the time of writing, voting in the United Kingdom is underway on the referendum on membership in the European Union (EU). Sentiment flipped rather dramatically on “Brexit” in recent days. The week started with a lot of relief and a plunge in the volatility index, the VIX. However, the VIX rallied off its lows and continued to increase from there. Suddenly, the VIX is right back to “elevated” levels (above 20) and at its highest close in 4 months.
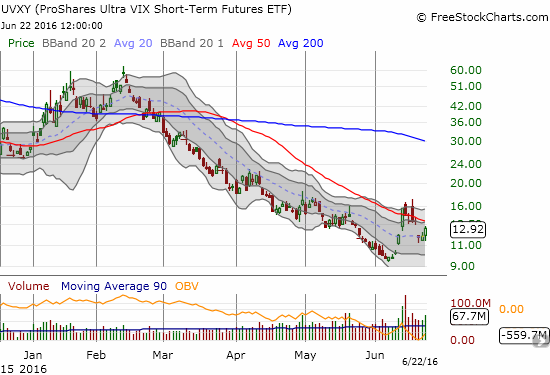
This flip flop aligns relatively well with a brief fallback in Brexit sentiment via Google trends of search terms. Google Trends fell back sharply Friday and Saturday only to rally from there to yet new highs. So, the VIX and Brexit sentiment are in agreement.
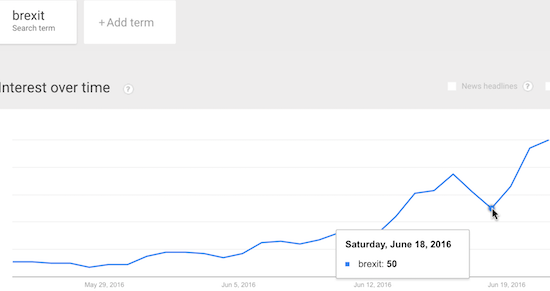
Source: Google Trends
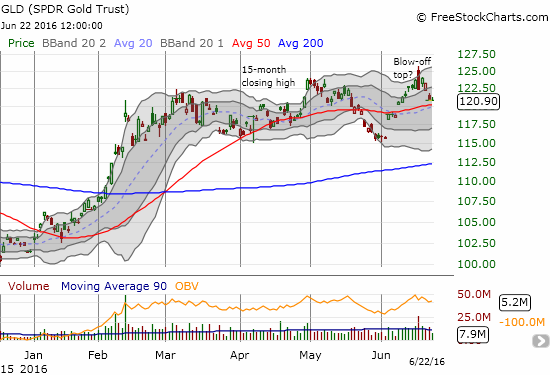
While the VIX and sentiment show elevated fear and anxiety again, other potential indicators of fear are going int he exact opposite direction. I posted several days ago on the case for a blow-off top in SPDR Gold Shares (GLD). After two additional days of selling, GLD sits just above 50DMA support. The follow-through selling has effectively confirmed the top, but a break of 50DMA support would further solidify the case.
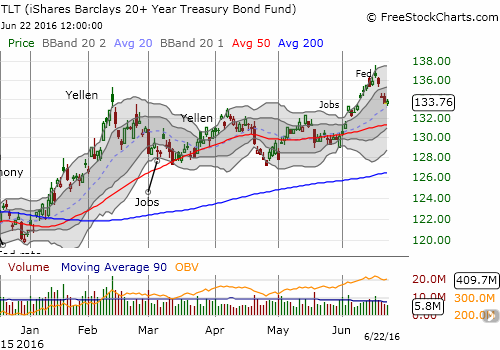
Like GLD, the iShares 20+ Year Treasury Bond (TLT) has also stood down from a major topping pattern on June 16th. TLT is trying to hold support at its uptrending 20DMA. I am guessing it will tumble to its 50DMA before finding solid support. TLT rallied into June 16th as fears mounted in financial markets.
To round out this intriguing divergence in fear, the Japanese yen (FXY) has sold off since the key turning point day of June 16th. The Japanese yen is interesting because of its conventional treatment as a “safety” currency. Against the resurgent British pound (FXB), the focus of Brexit of course, the Japanese yen’s has faded sharply along with the fades in GLD and TLT.
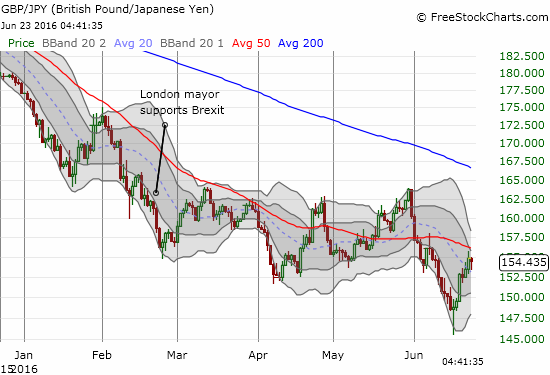
So, the VIX’s surge today stands out like a sore thumb against GLD, TLT, and FXY (through GBP/JPY for example). Seeing this divergence encouraged me to sell call options against my accumulated position in UVXY. The premiums are quite large for July 1st expiration. I started this position, along with long call options, on June 16th thinking it was time to get back to going long volatility. The typical market soothing of the Federal Reserve’s latest pronouncements on monetary policy had come and gone. Instead, it was a day that delivered a synchronized whiplash.
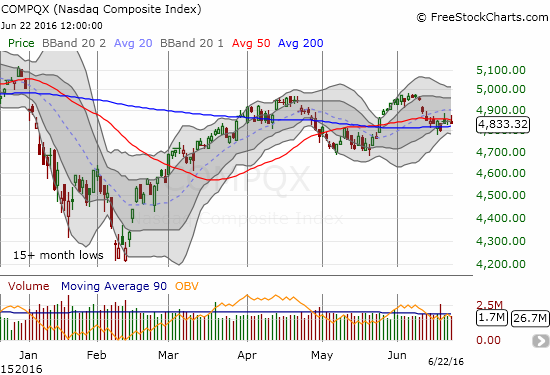
Still, through all the gyrations, my short-term trading call has stayed bearish. The S&P 500 (SPY) is valiantly clinging to its 50DMA, but the index needs to BOTH recover overbought conditions AND punch through the all-time high in order to invalidate the bearish drop out of overbought conditions. The NASDAQ (QQQ) is also hanging close to its 50DMA although as resistance.
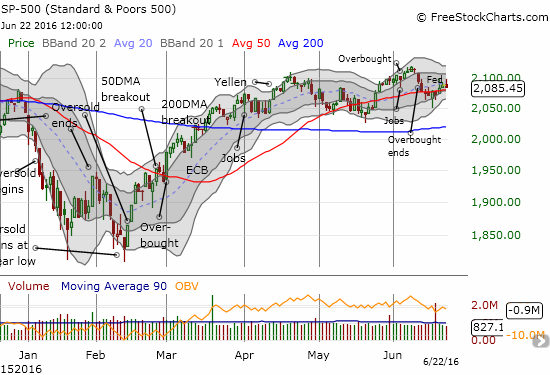
The fall from overbought conditions on Friday, June 10th quickly resolved into a bottom six calendar days later. The bounce from that low also moved swiftly. In two more trading days, T2108, the percentage of stocks trading above their respective 40DMAs, surged as high as 65.9% before cooling off to today’s close at 56.7%. This second fade seems to confirm T2108’s bearish fall from overbought conditions.
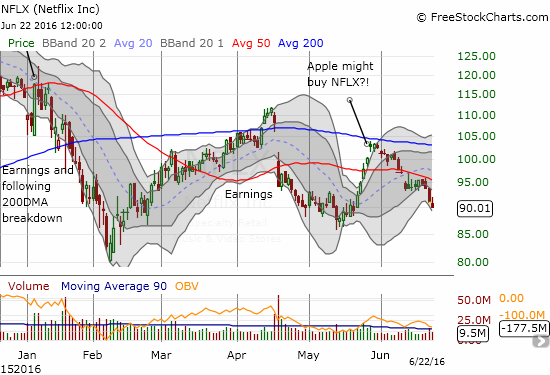
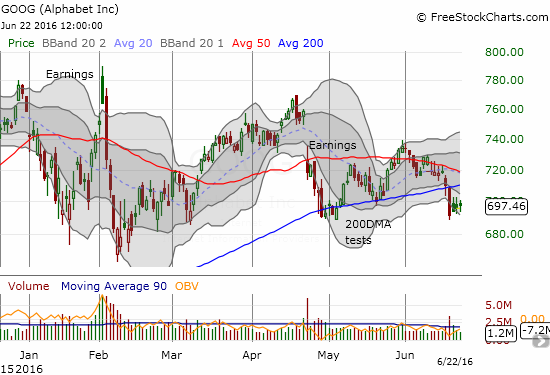
There are other very telling charts out in the market. Two of the big cap tech darlings are suddenly faring poorly from a technical perspective. Netflix (NFLX) confirmed its 50DMA as resistance and looks very ready to resume a sell-off that started with earnings. Alphabet (GOOG) was slammed last week with a downgrade. The stock broke 200DMA support on volume. Buyers are trying their best to keep GOOG form confirming this breakdown.
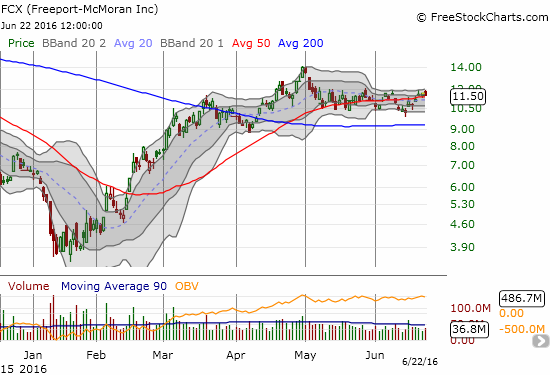
While darling tech stocks falter, commodity stocks are hanging in there in general. One great example is Freeport-McMoRan Inc. (FCX). I mentioned FCX in an earlier post as a commodity stock to play through what has become a very well-defined trading range. My first trade was a fade, and it worked well. My second fade will likely not work well – in retrospect I should have waited out Brexit before trying the second round. I am positioning for the next round by Friday…as long as FCX does not break out first.
— – —
Reference Charts (click for view of last 6 months from Stockcharts.com):
S&P 500 or SPY
U.S. Dollar Index (U.S. dollar)
EEM (iShares MSCI Emerging Markets)
VIX (volatility index)
VXX (iPath S&P 500 VIX Short-Term Futures ETN)
EWG (iShares MSCI Germany Index Fund)
CAT (Caterpillar).
IBB (iShares Nasdaq Biotechnology).
Daily T2108 vs the S&P 500

Black line: T2108 (measured on the right); Green line: S&P 500 (for comparative purposes)
Red line: T2108 Overbought (70%); Blue line: T2108 Oversold (20%)
Weekly T2108

*All charts created using freestockcharts.com unless otherwise stated
The charts above are the my LATEST updates independent of the date of this given T2108 post. For my latest T2108 post click here.
Related links:
The T2108 Resource Page
Be careful out there!
Full disclosure: long GLD, net short the Japanese yen, long UVXY shares and put options, short UVXY call options, short the British pound (trading in and out long and short until Brexit vote closes), long SSO put options
