
(T2108 measures the percentage of stocks trading above their respective 40-day moving averages [DMAs]. It helps to identify extremes in market sentiment that are likely to reverse. To learn more about it, see my T2108 Resource Page. You can follow real-time T2108 commentary on twitter using the #T2108 hashtag. T2108-related trades and other trades are occasionally posted on twitter using the #120trade hashtag. T2107 measures the percentage of stocks trading above their respective 200DMAs)
T2108 Status: 48.7%
T2107 Status: 60.6%
VIX Status: 20.5 (follows 2 days of surges: 16.3% and 23%)
General (Short-term) Trading Call: bearish
Active T2108 periods: Day #85 over 20%, Day #84 over 30%, Day #81 over 40%, Day #1 under 50% (ending 15 days over 50%), Day #2 under 60%, Day #3 under 70%
Commentary
The current drop from overbought conditions is living up to the historical pattern. T2108 closed at 48.7% on just the third day out of overbought territory. My favorite technical indicator traded as low as 45.3%. The S&P 500 (SPY) has sold off as well and today broke through support at its 50-day moving average (DMA). This confirms the bearish turn of events however the index has not lost a lot of ground on a percentage basis. The last three days of selling have delivered losses of 0.7%, 0.8%, and today 0.2%. In other words, even with the 50DMA breakdown, the index is “hiding” a lot of damage hitting stocks broadly.
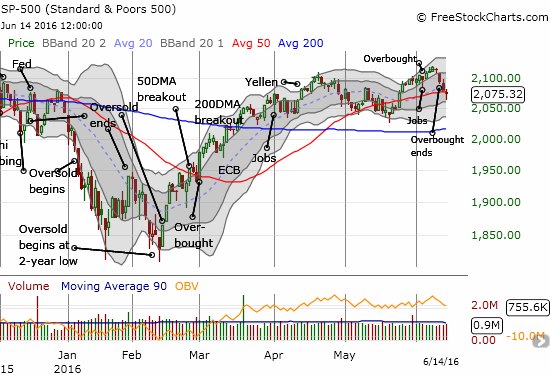
In the caption above, I point to the hammer-like chart pattern because the U.S. Federal Reserve is coming up with a shot at rescuing the market from its current mental funk. It is very possible shorts have already started the process of clearing the path by locking in profits. The action in the volatility index, the VIX, is also very telling.
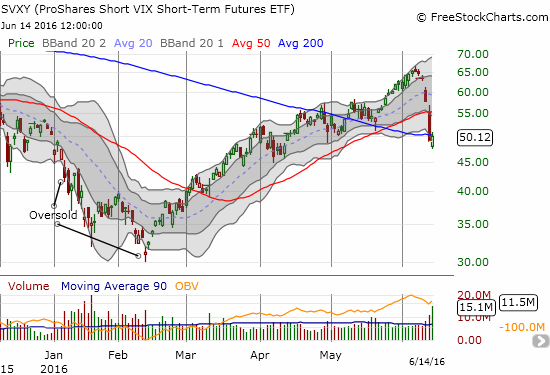
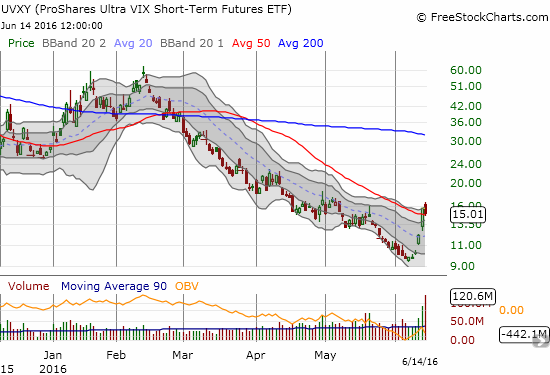
You might never guess that the S&P 500 lost as little as it has if you only had the volatility index, the VIX, as a clue. I would excuse you for assuming some major sell-off is underway. The gains in the VIX have been massive: on Friday a 16% gain, on Monday a whopping 24% gain. Today, the VIX once again soared but stopped a little over 22 before reversing for a LOSS on the day of 2.2%. I think traders are already starting to anticipate the soothing words of the Fed. Per my own anti-volatility pre-Fed trade, I bought a small number of shares of ProShares Short VIX Short-Term Futures (SVXY) given the VIX was trading so far above its upper-Bollinger Band (BB). I added put options on ProShares Ultra VIX Short-Term Futures (UVXY) today. I wanted to double down, but UVXY mostly declined from my buy point.
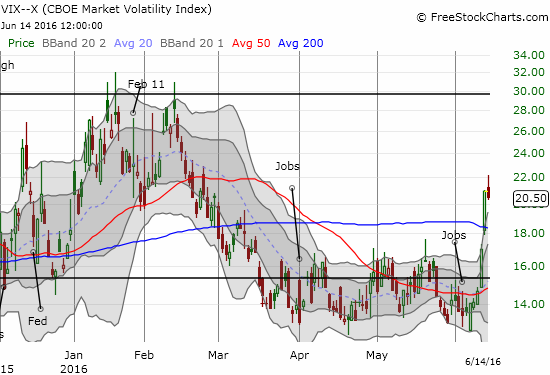
Wells Fargo analyst Janet Mirasola quoted some VIX stats to demonstrate the oddity of the VIX’s burst:
“Yesterday [Monday, June 13, 2016] the VIX surged by 23%, the largest percentage rise for the index on a day when the S%P 500 fell less than 1% since 1990. Trading volume was also heavy with 1.87 million VIX options changing hands, its third busiest day on record.”
Could this surprising “mismatch” indicate that traders are gobbling up S&P 500 put options to protect against something external to the U.S.? Brexit perhaps? As another reminder, I point the reader to the T2108 Update from June 3rd:
“I do not have to turn bearish to see this picture and wonder aloud whether this complacency is far too high (the VIX far too low). It is definitely possible that the market is under-pricing risk because it now expects the Fed to leave rates alone until at best the end of the year. Yet, time and again, the VIX has failed to stay at these levels for long. The risk/reward balance has shifted toward betting on an increase in volatility even if the S&P 500 maintains its generally bullish stance by holding support at its 50DMA or even holding the low of the current trading range.”
To this I add a reference to my June 5th post where I noted the market seemed to lag the heightened sense of risk that seemed apparent in Brexit sentiment. I concluded the market was providing a unique trading opportunity. Put 2 and 2 together and, voila, a recipe for a soaring VIX. Note that per the plan I noted earlier, I sold my UVXY call options and locked in those profits. I am undecided as to whether I will go back to a bullish volatility position after the Fed trade ends.
Even if the Fed somehow fails to calm markets, other major central banks are preparing their own soothing elixirs. Reuters reported from “sources” that the European Central Bank (ECB) and the Bank of England (BoE) are making plans to flood the market with liquidity in the event the UK votes to leave the EU:
“‘There will be a statement to do whatever it takes to maintain adequate market liquidity,’ said one senior central bank official, who spoke on condition of anonymity.
The ECB’s pledge would involve opening so-called swap lines with the Bank of England, allowing euros and sterling to be exchanged and effectively making unlimited funding in both currencies available to European banks, the sources said.”
Yes, financial authorities have a LARGE incentive to leak this information early. They certainly hope to prime calm in the markets ahead of the vote. This story may already be working.
There is a flip side to this sudden and tremendous rush for protection. Traders may not panic out of stocks if the feared event – a UK exit from the European Union (EU) – materializes. Traders may now have sufficient protection to get them through…in the U.S. at least.
There is also a VERY intriguing backdrop to this fear. Fund managers are raising cash. From the WSJ:
“Fund managers globally hold more cash now than they have at any other time during the past six months, according to a survey released Tuesday by Bank of America Merrill Lynch. In Europe, fund managers are holding more than they have since the depths of the financial crisis in March 2009…
The survey, which includes responses from 167 fund managers with a combined $437 billion in assets under management, shows that the average portfolio was 4.9% invested in cash during that period, up from 4.5% in the equivalent period in May. European investors’ cash levels rose to 4.9% from 4.4%.”
The article did not note whether this drawdown is a seasonal act. In other words, we need a comparison with cash levels from a year ago. Regardless, at the margins this cash now sits on the sidelines itching to get redeployed into the market. That cash could determine the difference between a persistent sell-off (cash stays on the sideline) and a quick sell-off (cash rushes back in). Then again, the drawdown may just be getting started!
Note well that my trading call remains firmly bearish. I am just acknowledging imminent scenarios that could spark market rallies. Unless technicals change for the better, I plan to fade such rallies (and reduce longs further).
Three major stocks tell great stories of the current volatility.
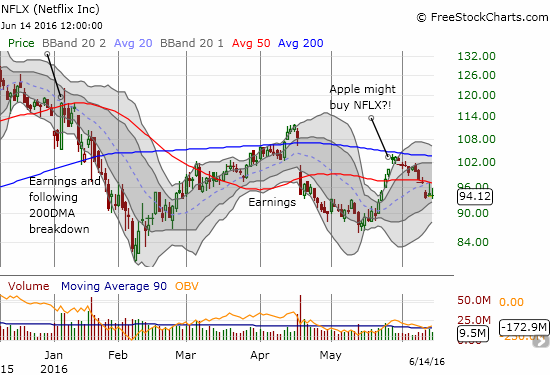
Netflix (NFLX) ended last week with a bearish 50DMA breakdown. On Monday, the stock rallied over 3% despite the general market’s sell-off. Sellers finally regained control at 50DMA resistance and managed to reverse all of NFLX’s gains. Today, the stock had almost the same range and ended the day essentially flat. I think a much bigger move is in the works here once the trader ping-pong ends.
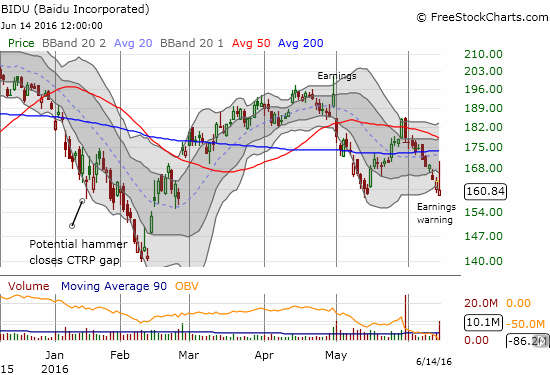
Baidu (BIDU) delivered an earnings warning Monday night that reportedly took the stock down about 7% in after-hours trading. By pre-market trading I noticed BIDU was down only 2%. By the open, BIDU was only down 2 points. The stock proceeded to rally quickly form there. In the middle of the rally, I bought call and put options in anticipation of a big move (too many times in these wild situations I pick a side, lose, and then realize I could have profited by playing a hedged strategy). I was not able to lock in the profits from the call options as BIDU soared all the way to $170. After the dust settled, BIDU ended with a 1.7% loss.
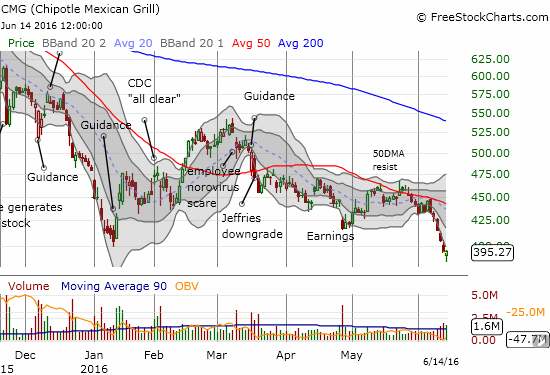
Chipotle Mexican Grill (CMG) has been a huge disappointment since recovering quickly from April’s post-earnings gap down. (I wrote is support of trading the stock back in March). The recovery ended after two failed attempts to crack 50DMA resistance. The subsequent selling generated one last failed 50DMA test before a steep 5-day sell-off. Over the last three days of that sell-off, CMG managed to close below its lower-BB. Today it also closed below its lower BB but managed a fractional gain at the close. THAT kind of selling is some kind of pressure!
The buying in CMG started deep below the lower-BB and formed what looks like a bottoming hammer. This hammer is in dire need of confirmation of course. In the meantime, I am still waiting for definitive news to explain the renewed selling. I have seen downgrades, but I am surprised they are enough for this kind of renewed selling. Is another bomb getting ready to drop…?
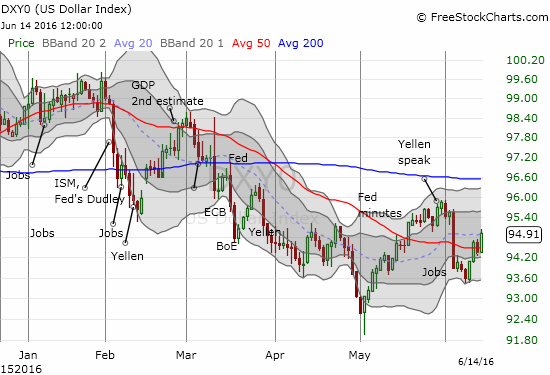
Finally, in the land of currencies, the dollar finds itself rallying into a Fed meeting WITHOUT the expectation of hawkish talk or rate hikes. A complete reversal of the steep post-jobs loss seems in the cards now Europe no longer offers attractive anti-dollar bets.
— – —
Reference Charts (click for view of last 6 months from Stockcharts.com):
S&P 500 or SPY
U.S. Dollar Index (U.S. dollar)
EEM (iShares MSCI Emerging Markets)
VIX (volatility index)
VXX (iPath S&P 500 VIX Short-Term Futures ETN)
EWG (iShares MSCI Germany Index Fund)
CAT (Caterpillar).
IBB (iShares Nasdaq Biotechnology).
Daily T2108 vs the S&P 500
")
Black line: T2108 (measured on the right); Green line: S&P 500 (for comparative purposes)
Red line: T2108 Overbought (70%); Blue line: T2108 Oversold (20%)
Weekly T2108

*All charts created using freestockcharts.com unless otherwise stated
The charts above are the my LATEST updates independent of the date of this given T2108 post. For my latest T2108 post click here.
Related links:
The T2108 Resource Page
Expanded daily chart of T2108 versus the S&P 500
Expanded weekly chart of T2108
Be careful out there!
Full disclosure: net long the U.S. dollar, long UVXY put options, long SVXY, long NFLX call and put options, long CMG shares, call, and put options