
(T2108 measures the percentage of stocks trading above their respective 40-day moving averages [DMAs]. It helps to identify extremes in market sentiment that are likely to reverse. To learn more about it, see my T2108 Resource Page. You can follow real-time T2108 commentary on twitter using the #T2108 hashtag. T2108-related trades and other trades are occasionally posted on twitter using the #120trade hashtag. T2107 measures the percentage of stocks trading above their respective 200DMAs)
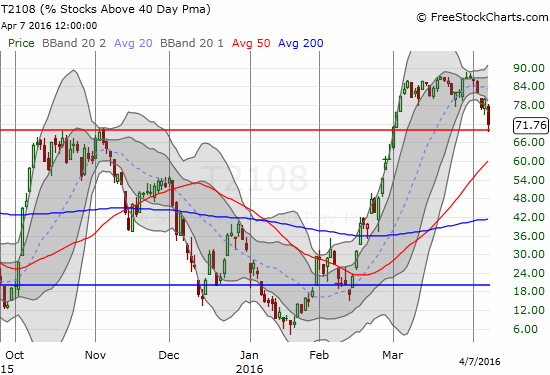
T2108 Status: 71.8% (low of the day was 69.2%)
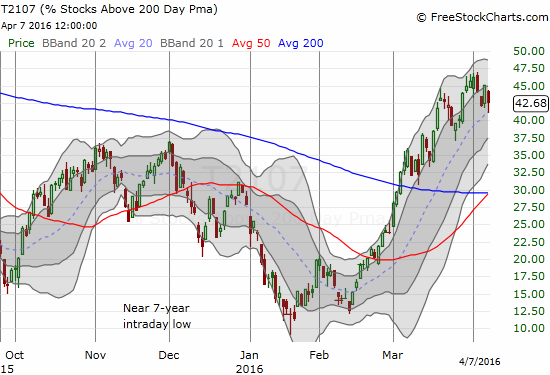
T2107 Status: 42.7%
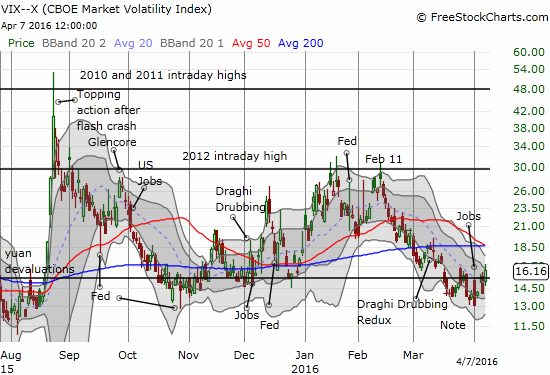
VIX Status: 16.2
General (Short-term) Trading Call: neutral
Active T2108 periods: Day #39 over 20%, Day #38 over 30%, Day #35 over 40%, Day #32 over 50%, Day #28 over 60%, Day #27 over 70% (overbought)
Commentary
In my last #T2108 Update, I had 2 ST trading scenarios. The unlikely one is happening: %stocks>40DMA dropping from overbought status! $SPY
— Dr. Duru (@DrDuru) April 7, 2016
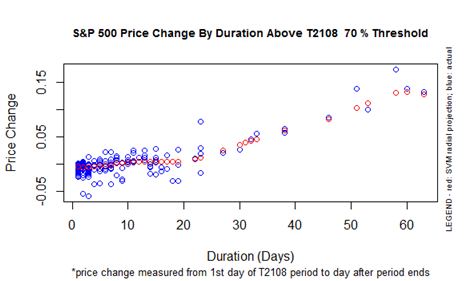
T2108, the percentage of stocks trading above their respective 40-day moving averages (DMAs) dropped as low as 69.2% before returning to overbought status for a 71.8% finish. That was a close call where I assumed that today would be the day that ended this formerly impressive overbought period. My running assumption has been that T2108 would begin the run-up implied in the chart below. T2108 has now been overbought, above 70%, for 27 trading days. The S&P 500 has gained 3.2% during this overbought period. If the overbought period ends Friday, the duration vs performance will likely be closely consistent with historical patterns.
I discussed the scenarios between an immediate end to the overbought period vs a renewed run-up in Friday’s piece “Weighing the Prospects for a Fresh Market Lift-Off.” By Tuesday, April 5th, I revised my thinking to give the bearish case more consideration in “A Nervous Market Awaits More Fed Refreshments.” I allowed for some Fed-related boosts. Like clockwork, the Fed minutes helped the market refresh and revive. My trade going long on ProShares Short VIX Short-Term Futures (SVXY) worked just about as well as I could expect. The market’s rally became so strong going into the release of the Fed minutes that I decided to lock in my profits ahead of the news. I lamented a bit leaving a half point or so on the table…until today’s subsequent sell-off.
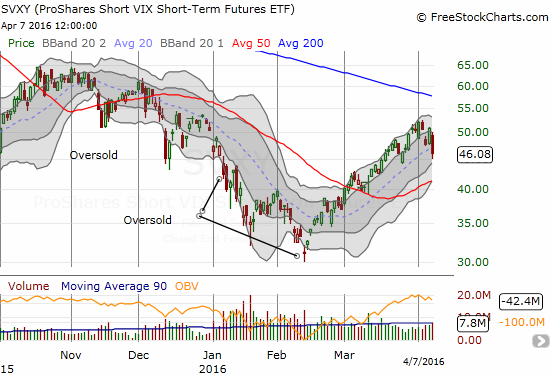
Sticking to the Fed-based plan, I bought into this sell-off and accumulated fresh shares. The intraday selling was so strong that I decided to try quickly flipping call options on ProShares Ultra VIX Short-Term Futures (UVXY)…and it worked well. Most bets are off if T2108 closes below 70% and ends this overbought period. I have learned from past history that the end of overbought periods can start a period of significant selling pressure. This behavior is partially why my revised T2108 trading rules dictate waiting out the overbought period before getting bearish. I am however prepared to stay flexible given the last overbought period was in the summer of 2014.
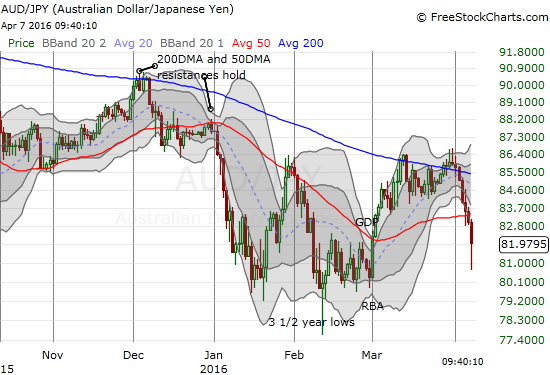
I am particularly concerned because the Japanese yen (FXY) continues to strengthen. In trading today, the yen got so extended that I finally closed out my short against the Australian dollar (FXA) using the yen. (Earlier in the week I closed out my latest large short position on GBP/JPY). At the time of writing, I started right back into a fresh short position as Asian trading began with a bit of a relief rally on AUD/JPY.
Yen is getting more and more extended. Trading well beyond Bollinger Bands on all major pairs. $AUDJPY $USDJPY $GBPJPY #forex
— Dr. Duru (@DrDuru) April 7, 2016
The last, lingering market positives are two-fold…
T2107, the percentage of stocks trading above their 200DMAs, has yet to experience a substantial setback…
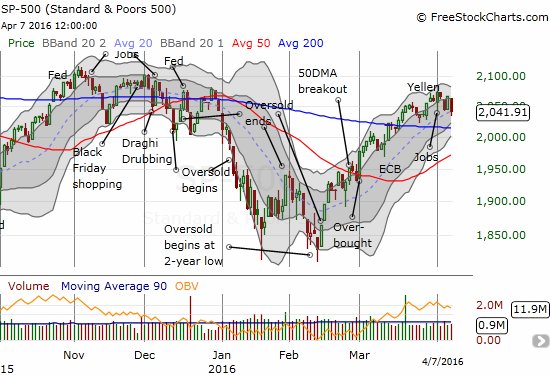
…and the S&P 500 (SPY) closed on top of 20DMA support just above its 200DMA support.
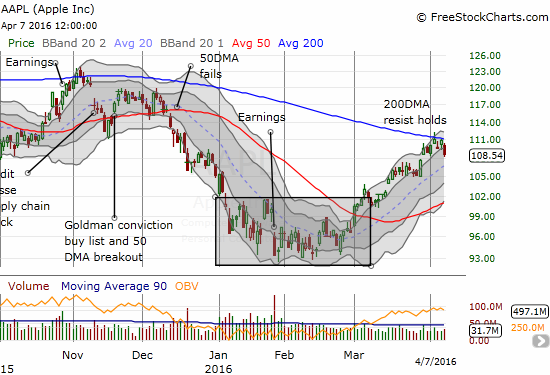
It looks like the market will lose an opportunity for an important victory from Apple (AAPL). After the breakout shown below, AAPL steadily, stubbornly, and persistently rolled higher toward its 200DMA line of resistance. Today’s selling unfortunately confirmed the failure of that test. AAPL will need a fresh catalyst, probably earnings, before it can do its part to help lift T2107.
I will be almost on the edge of my seat for Friday’s trading. I am disinclined to take SVXY through the weekend. I am looking to the meeting of Fed Heads this evening to generate some positive and soothing words for the market. Most importantly, I will be watching to see whether this week will close with the overbought period intact…it will be a close call.
— – —
For readers interested in reviewing my trading rules for an oversold T2108, please see my post in the wake of the August Angst, “How To Profit From An EPIC Oversold Period“, and/or review my T2108 Resource Page.
Reference Charts (click for view of last 6 months from Stockcharts.com):
S&P 500 or SPY
U.S. Dollar Index (U.S. dollar)
EEM (iShares MSCI Emerging Markets)
VIX (volatility index)
VXX (iPath S&P 500 VIX Short-Term Futures ETN)
EWG (iShares MSCI Germany Index Fund)
CAT (Caterpillar).
IBB (iShares Nasdaq Biotechnology).
Daily T2108 vs the S&P 500
")
Black line: T2108 (measured on the right); Green line: S&P 500 (for comparative purposes)
Red line: T2108 Overbought (70%); Blue line: T2108 Oversold (20%)
Weekly T2108

*All charts created using freestockcharts.com unless otherwise stated
The charts above are the my LATEST updates independent of the date of this given T2108 post. For my latest T2108 post click here.
Related links:
The T2108 Resource Page
Expanded daily chart of T2108 versus the S&P 500
Expanded weekly chart of T2108
Be careful out there!
Full disclosure: long SVXY, long USD/JPY, short AUD/JPY