
(T2108 measures the percentage of stocks trading above their respective 40-day moving averages [DMAs]. It helps to identify extremes in market sentiment that are likely to reverse. To learn more about it, see my T2108 Resource Page. You can follow real-time T2108 commentary on twitter using the #T2108 hashtag. T2108-related trades and other trades are occasionally posted on twitter using the #120trade hashtag. T2107 measures the percentage of stocks trading above their respective 200DMAs)
T2108 Status: 77.5% (ending 22 days over 80%!)
T2107 Status: 42.3%
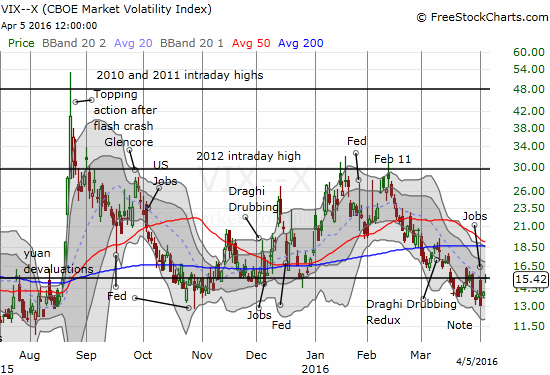
VIX Status: 15.4
General (Short-term) Trading Call: neutral
Active T2108 periods: Day #37 over 20%, Day #36 over 30%, Day #33 over 40%, Day #30 over 50%, Day #26 over 60%, Day #25 over 70%
Commentary
In my last T2108 Update, I weighed the prospects for a fresh market lift-off. I presented two core scenarios and concluded that the scenario featuring a quick end to this extended overbought period is unlikely. Well, just like that, the unlikely became a lot more likely.
Before I discuss the warning signs, I will note that the last time I gave serious consideration to a bearish case was in “A Sinking Feeling” on March 23rd. The S&P 500 (SPY) is up just 0.4% since then. However, in between, Federal Reserve Chair Janet Yellen was able to push the market’s refresh button and give the market a temporary boost. Up just ahead from this bearishly tinted moment we have the release of the minutes from the Fed’s last pronouncement on monetary policy (the S&P 500 is up 0.8% since then). We also have a rare consortium of “Fed Heads” gathering after market hours on Thursday. Volcker, Greenspan, Bernanke, and Yellen are meeting…to do what, I am honestly not sure. But I am betting they will do their best to make the meeting a market-positive event. In other words, the Fed sits nearby to turn frowns upside down.
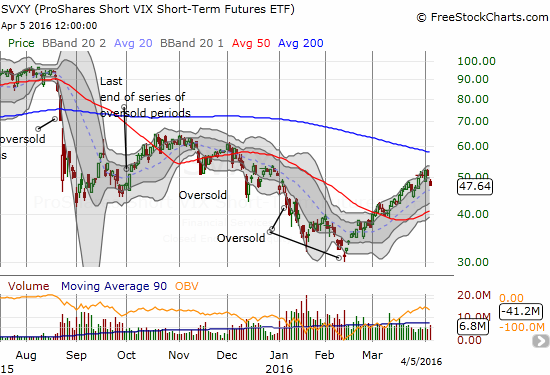
I will likely try to play this caveat on bearish tidings by buying (short-term) shares in ProShares Short VIX Short-Term Futures (SVXY) under the assumption that, as is so often the case, the market will find enough soothing from the Fed to drive volatility back down. Today, the volatility index, the VIX, popped back into the 15.35 pivot. SVXY dropped out of its primary uptrend channel as defined by its upper Bollinger Bands (BBs), but the 20-day moving average (DMA) sits directly below to provide uptrending support.
OK. Back to the bearish tidings.
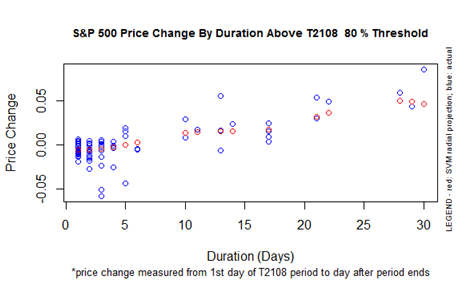
T2108 closed at 77.5%. This drop ended 22 days of trading above the 80% threshold. As I discussed in the last T2108 Update, the clock was already ticking on T2108’s stay above 80%: historically T2108 has never spent more than 30 days above the 80% threshold since at least 1986. The S&P 500 generated a 2.6% gain during this last 80% overperiod. This performance sits, nicely enough, exactly at the expected performance. (I love how these overperiods and underperiods provide such reliable guidance to the S&P 500’s short-term performance).
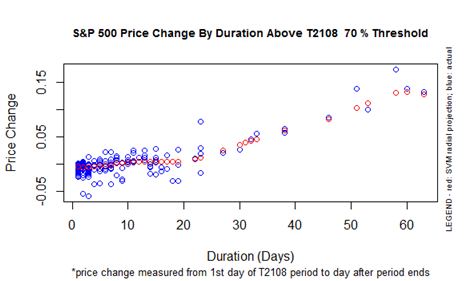
Now that the 80% overperiod has ended, a complete end to the overbought period is in play and more likely than it was just last Friday. T2108 has been overbought for 25 straight days. If the overbought period is going to end, it should be now…assuming history remains a good guide. Starting Wednesday, April 6, 2016, the S&P 500’s expected performance for the entire overbought period should will march steadily higher with each passing day. The S&P 500 has gained 3.4% so far during this overbought period – almost in line with expectations if the overbought period ended right here, right now.
The most alarming development comes from the Australian dollar (FXA) versus the Japanese yen (FXY). AUD/JPY not only failed to sustain a breakout from 200DMA resistance but also it broke down through 50DMA support today.
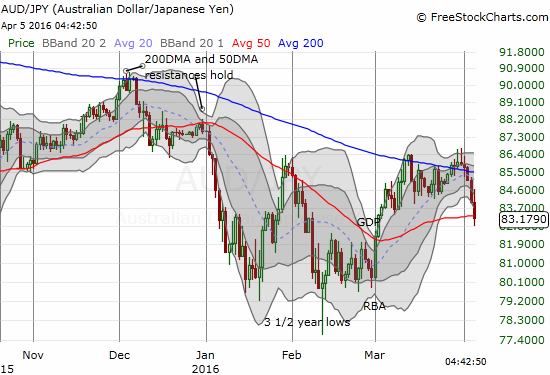
This is a very bearish signal that I cannot take lightly. Any market rally going forward must get confirmation from a rising AUD/JPY…otherwise, I will consider it suspect.
Overall, these signals have pushed me to change the trading call from cautiously bullish to neutral. An outright bearish call waits for the S&P 500’s next rendezvous with its 200DMA.
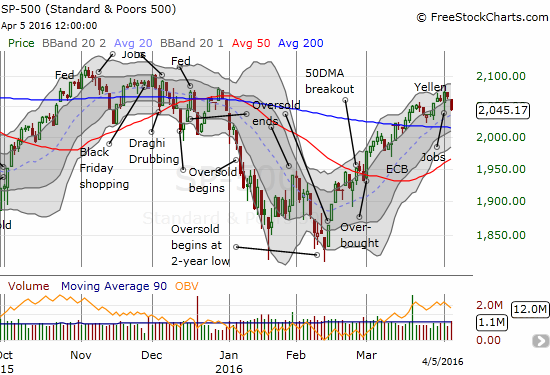
The S&P 500 lost 1.0% on the day and fell from its comfortable perch in the upward trend channel from its Bollinger Bands. Live SVXY, the index does have firm support at its rising 20DMA. This support needs to hold to keep the short-term bullish case going.
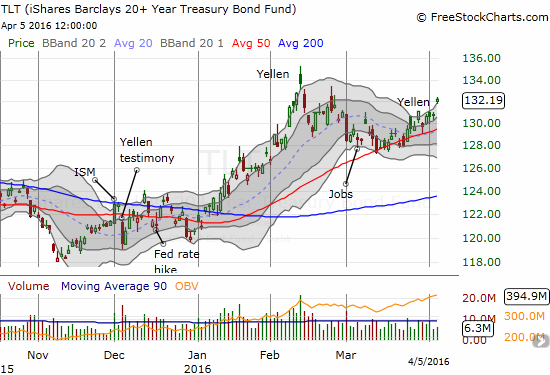
Adding to the VIX, the drop of T2108, the plunge in AUD/JPY, and the stumbling of the S&P 500, long-term bond yields are running up again. The iShares 20+ Year Treasury Bond (TLT) looks like it wants to launch another upper-BB run-up. I interpret the surge in TLT as indicative of risk aversion in the market.
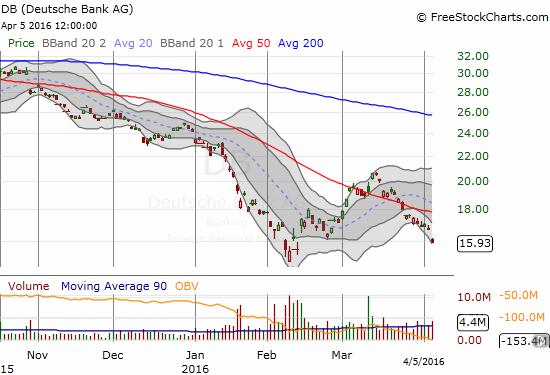
With rates marching lower, financials are right back in the dangerzone. Deutsche Bank AG (DB) has plenty of other trouble, company-specific and eurozone-related. DB last broke down below its 50DMA on March 23rd. I sold most of my fistful of put options on today’s big gap down.
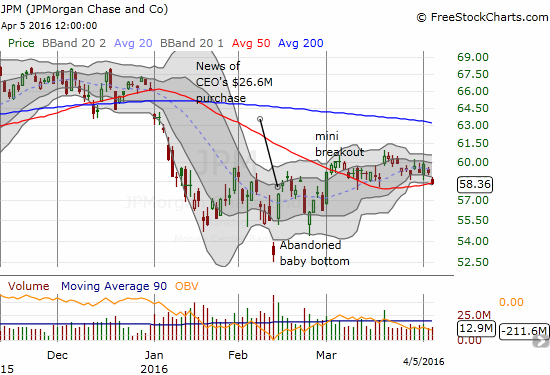
More importantly, JP Morgan Chase (JPM), the bank that helped get this rally going back in February, is teetering on support at its 50DMA. This support held throughout March and provided some psychological underpinnings to March’s blistering rally even if JPM barely benefited from it.
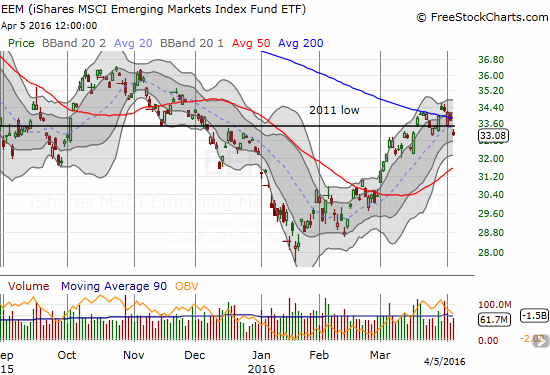
The iShares MSCI Emerging Markets (EEM) gapped down from its 200DMA support. This move looked bearish enough – with or without T2108 trading rules – for me to chase a bit with fresh put options. The promising 200DMA breakout looks already over. I did not bother setting up my usual hedged play with call options married to the puts.
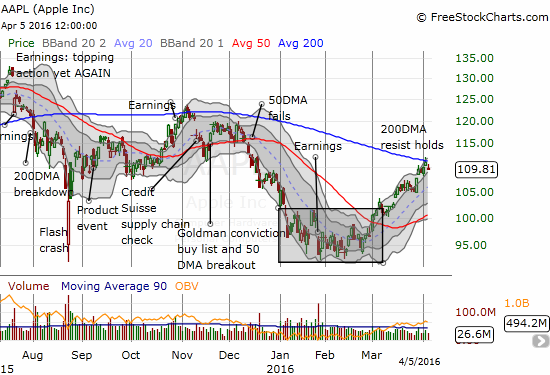
Apple (AAPL) has also reached a critical juncture – this one is a little more promising. Last week I claimed it was then or never to make a play on AAPL for a 200DMA retest. I bought call options and, sure enough, AAPL promptly moved to test 200DMA resistance on Monday. Normally, I would interpret the failure of a true breakout as an ominous sign. However, the trading volume is still light and AAPL is still trading in its uptrend channel. Still, I locked in the profits on my call options as I watch for the next trading opportunity.
— – —
For readers interested in reviewing my trading rules for an oversold T2108, please see my post in the wake of the August Angst, “How To Profit From An EPIC Oversold Period“, and/or review my T2108 Resource Page.
Reference Charts (click for view of last 6 months from Stockcharts.com):
S&P 500 or SPY
U.S. Dollar Index (U.S. dollar)
EEM (iShares MSCI Emerging Markets)
VIX (volatility index)
VXX (iPath S&P 500 VIX Short-Term Futures ETN)
EWG (iShares MSCI Germany Index Fund)
CAT (Caterpillar).
IBB (iShares Nasdaq Biotechnology).
Daily T2108 vs the S&P 500
")
Black line: T2108 (measured on the right); Green line: S&P 500 (for comparative purposes)
Red line: T2108 Overbought (70%); Blue line: T2108 Oversold (20%)
Weekly T2108

*All charts created using freestockcharts.com unless otherwise stated
The charts above are the my LATEST updates independent of the date of this given T2108 post. For my latest T2108 post click here.
Related links:
The T2108 Resource Page
Expanded daily chart of T2108 versus the S&P 500
Expanded weekly chart of T2108
Be careful out there!
Full disclosure: short AUD/JPY, long EEM put options, long TLT call options