
The last Housing Market Review covered data released in January, 2016. At the time, I warily looked at a nervous market and insisted that the steep decline in the iShares US Home Construction ETF (ITB) and individual home builder stocks presented a great buying opportunity. I was conservative in my expectations including looking out to 2017 for realizing the bulk of the potential upside. Fortunately, my positions have already experienced siginficant upside well ahead of schedule largely thanks to a very strong push from February’s lows and the last oversold period. I will cover some individual names in the “parting thoughts” section at the end of this review.
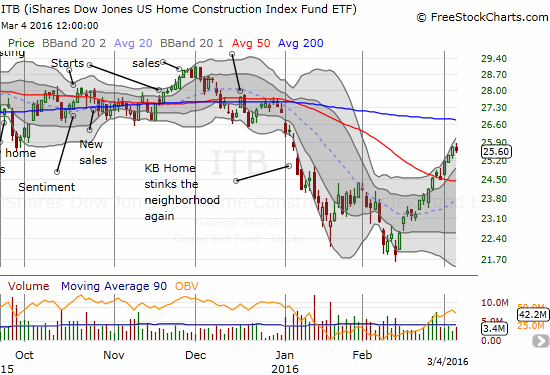
Source: FreeStockCharts.com
GDP
On Friday, February 26th, the U.S. Department of Commerce’s Bureau of Economic Analysis reported revised GDP results for Q4 2015. Q4 GDP includes a continuing strong performance for domestic private residential investment. Since Q4 of 2014, the quarterly percentage changes have ranged from 8 to 10% – very healthy numbers. These numbers are not surprising given the other strong results for 2015.
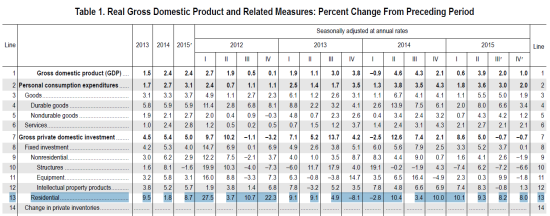
Source: Bureau of Economic Analysis
New Residential Construction (Housing Starts) – January, 2016
Privately owned housing starts for 1-unit structures came in at 731,000. The December 1-unit starts were revised slightly downward to 761,000. These numbers are well within the on-going uptrend in housing starts.
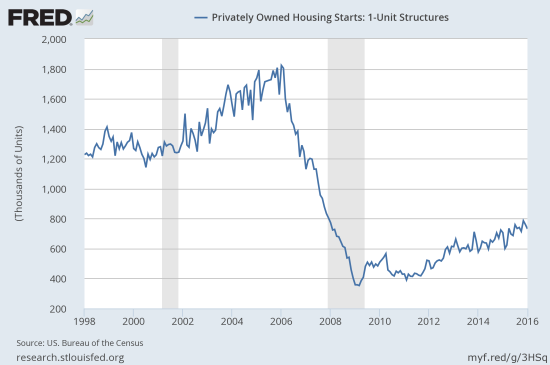
Source: US. Bureau of the Census, Privately Owned Housing Starts: 1-Unit Structures [HOUST1F], retrieved from FRED, Federal Reserve Bank of St. Louis, March 6, 2016.
The 3.5% year-over-year gain and 3.9% month-over-month drop are consistent with another mixed picture from the confidence of home builders (see below). The South led the regions with the only positive year-over-year gain at 10.7%. The South region includes Texas and thus continues to show remarkable resilience in the face of the collapse of the oil patch. The West led decliners with a 6.7% drop.
The overall trend and momentum for housing starts continue to encourage me.
New Residential Sales – January, 2016
New single-family home sales came in weak at 494,000. The 5.2% year-over-year drop and 9.2% monthly drop was a marked contrast from the year-over-year and monthly gains from the report on December, 2015. This performance places new home sales into a potential range that could soon contrast with the rising trend in starts.
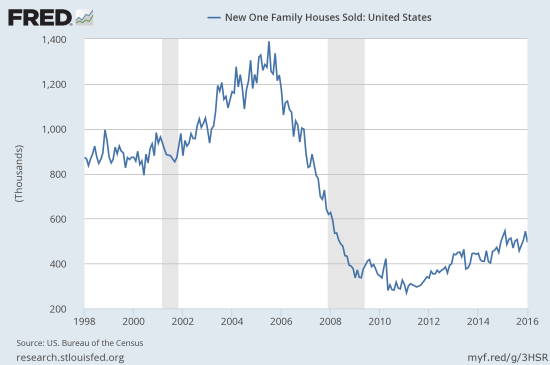
Source: US. Bureau of the Census, New One Family Houses Sold: United States [HSN1F], retrieved from FRED, Federal Reserve Bank of St. Louis, March 6, 2016.
The drop in sales brought new home inventory from 5.2 months to 5.8. This more in-line with the six months typically considered balanced. Hopefully, the boost in availability will get more sales going in the coming months. The Northeast bucked the trend for the month with a surge in sales which increased 100% from year-ago levels. This was a direct contrast to December’s 6.5% year-over-year drop. So, the Northeast is likely just being volatile. The Midwest and the South had low single-digit losses. The sales in the South are continuing to slow down, so I remain on alert for Texas despite the strong showing for housing starts in the South. The West was the region that really drove the plunge in new home sales with a 24.1% year-over-year drop. Given this was a flip-flop from December’s 21.9% year-over-year surge, I will cause this performance a wash.
Existing Home Sales – January, 2016
Existing home sales performed a lot better than new home sales. The National Association of Realtors (NAR) reported “Existing-home sales crept forward in January to the highest annual rate in six months, and subpar supply levels propelled price growth to the fastest increase since last April…The West was the only region to see a decline in sales in January.” On a year-over-year basis, existing home sales increased a very healthy 11.0%. This is the best year-over-year performance since the 16.3% gain in July, 2013. The robust sales for existing homes gives me confidence that new home sales will pick up again soon.
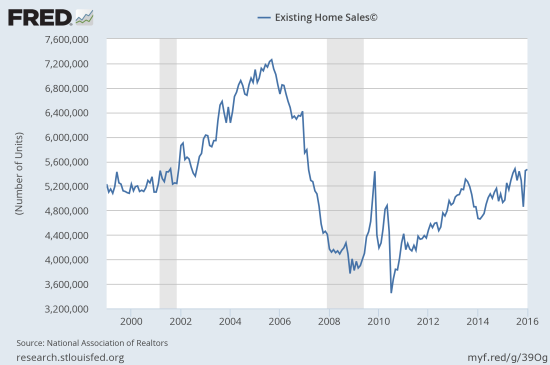
Source: National Association of Realtors, Existing Home Sales© [EXHOSLUSM495S], retrieved from FRED, Federal Reserve Bank of St. Louis, March 6, 2016.
Although housing inventory increased 3.4% from the prior month this is still down 2.2% from a year-ago. Months of inventory nudged up from 3.9 to 4.0 months. Last months inventory was the lowest since 3.6 months of supply in January, 2005. This inventory is far too low for a balanced market and is contributing to blistering price increases. The 8.2% year-over-year jump in the median sales price was the highest since April, 2015. Prices have climbed for 47 straight months. The low supply and surging prices are causing concern for NAR’s chief economist Lawrence Yun regarding the Spring selling season:
“The spring buying season is right around the corner and current supply levels aren’t even close to what’s needed to accommodate the subsequent growth in housing demand…Home prices ascending near or above double-digit appreciation aren’t healthy – especially considering the fact that household income and wages are barely rising.”
The poor inventory and price environment has not detered first-time homebuyers at least. They represent 32% of the market which is up from 28% in January, 2015.
Home Builder Confidence: The Housing Market Index– February, 2016
The Housing Market Index (HMI) dropped to 58 in February. In the last Housing Market Review, I cited a rare and troubling divergence between current and future sales conditions. In February, current conditions, finally responded with a three point dip from 68 to 65. Sales expectations 6 months stabilized a bit by increasing by a point. However, the component for buyer traffic plunged. This component has not been this low since May, 2015. So once again, the HMI is sending mixed messages which provide a tight cap on my optimism for the Spring selling season. The NAHB’s explanations are as usual inadequate. The group claims that builders are reflecting consumer concerns yet consumer confidence has stabilized in recent months and remains at lofty levels.
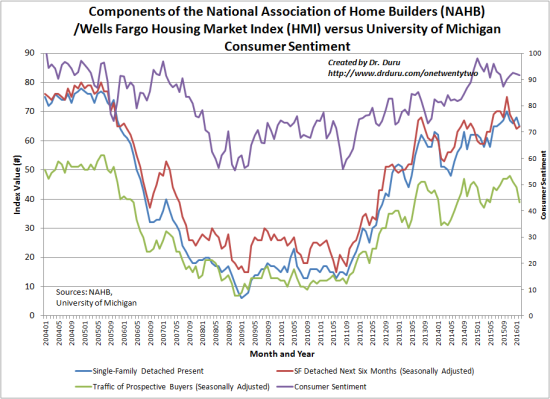
Source: The National Association of Home Builders (NAHB)
The three-month moving averages for regional HMI scores declined again in all four regions of the country. This broad decline continues to grab my attention along with the breakdown of the individual components.
Parting thoughts
I earlier thought the strong housing numbers of 2015 augured well for the Spring selling season. The HMI in particular has tempered my expectations. I find it ironic that ITB is moving higher against what I see as yellow flags when it was declining a month ago amid what I thought were hopeful signs. Fortunately, my previous optimism paid off in some timely purchases in a range of home builder shares and call options. The big drops and some low valuations to start the year had me salivating for good entry points.
KB Home (KBH) has turned into my biggest winner of the bunch given the large number of fortuitously timed call options I bought based on my analysis in “KB Home Stinks The Neighborhood Again, But I Am Holding My Nose This Time.” After a month-long churn, KBH took off like a rocket after the general market bottomed in mid-February. KBH is up 34.1% from the time of writing and up 38.2% from the February 3 1/2 year low. KBH is now trading just under its 200-day moving average (DMA) resistance and well ahead of schedule for me. I will likely be selling my position this week and locking in profits to manage my risk/reward. Note that I have NOT turned bearish on KBH. The stock’s ability to close the January post-earnings gap down is a very bullish sign.
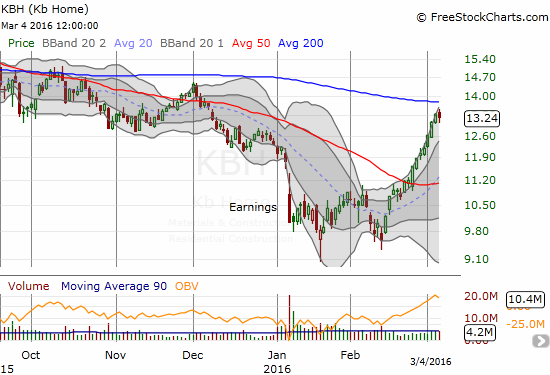
Source: FreeStockCharts.com
LGI Homes, Inc. (LGIH) is another builder off intense interest. The stock is trying to hang on after a blistering sell-off in December. The chart below shows how the stock failed all week to break resistance at the 200DMA before sellers gathered in force on Friday. With earnings coming on March 9, I am probably going to lock in profits here. I will take my next steps based on how the market responds to the earnings report.
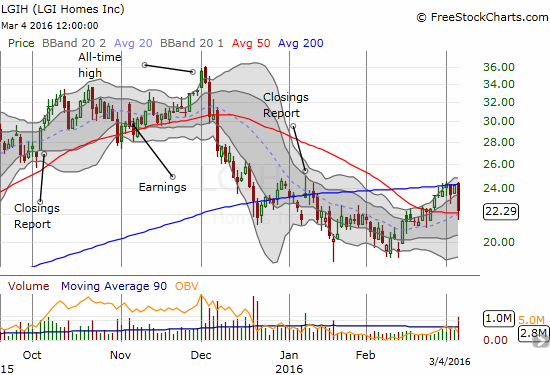
Source: FreeStockCharts.com
I am holding onto my other positions for now. Going forward I will base my selling decisions based on how this overbought period in the market unfolds. I explain my overall trading rules in “The Underlying Bullishness of the S&P 500’s Melt Up to 1999.99.”
Be careful out there!
Full disclosure: long ITB call options, long KBH call options, long LGIH shares