
The housing market is moving in slow motion. The recovery is in place but locked into low gear. Until conditions change materially, it makes sense to place my coverage of the overall housing market into a monthly cadence. The reporting loses a bit of timeliness, but it should gain more cohesiveness with more connected dots. Moreover, my work will get more efficient.
All coverage refers to the latest data available. Note this coverage is not a comprehensive report of all available U.S. housing data. I am focused on the data I find most interesting and relevant to trading housing-related stocks. I am also mainly focused on single-family housing for this report.
New Residential Construction (Housing Starts) – November, 2015
Privately owned housing starts for 1-unit structures hit a new post-recession record of 768,000. This beat out the previous record of 758,000 hit in July, 2015.
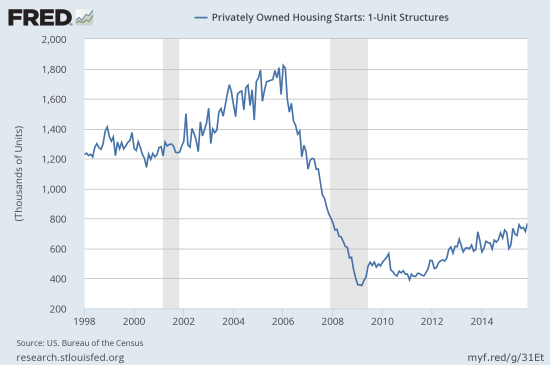
Source: US. Bureau of the Census, Privately Owned Housing Starts: 1-Unit Structures [HOUST1F], retrieved from FRED, Federal Reserve Bank of St. Louis, January 2, 2016.
The 14.6% year-over-year gain and 7.6% month-over-month gain reflects on-going strength in the confidence of home builders (see below). The percentage gains were robust across three of four regions: Northeast 9.1%, South 13.3%, West 31.7%. The Midwest lagged by a mile with a 0.9% drop. The starts in the West are particularly encouraging because of the chronic shortage in so many markets in the region. These strong numbers augur well for housing sales in the Spring selling season and beyond assuming builders remain well-tuned to the market.
New Residential Sales – November, 2015
New single-family home sales hit 490,000, a 9.1% year-over-year gain and increase of 4.3% over October’s sales. Despite these increases, the overall trend for 2015 still points downward from the post-recession peak hit in January, 2015. The pace of housing starts suggests that these sales should make a notable turn-around in the coming months.
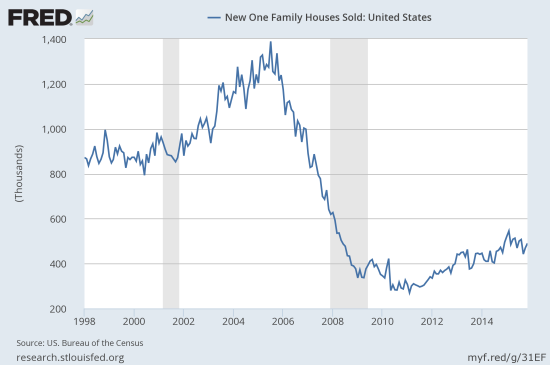
Source: US. Bureau of the Census, New One Family Houses Sold: United States [HSN1F], retrieved from FRED, Federal Reserve Bank of St. Louis, January 2, 2016.
Although inventory shortages are a problem in particular markets, the market for new homes is roughly in balance at 5.7 months the current sales rate. Six months is typically considered balanced.
Ever since the housing market hit its trough in 2012, dramatic downturns in economic indicators have been rare. A rare drop is exactly what happened to existing home sales in November. Total single-family existing home sales fell 3.8% year-over-year and a whopping 10.5% month-over-month. The National Association of Realtors (NA) blamed the broad-based drop across all regions on a large pushout of closings.
“…multiple factors led to November’s sales decline, but the primary reason could be an anomaly as the industry adjusts to the new Know Before You Owe rule. Sparse inventory and affordability issues continue to impede a large pool of buyers’ ability to buy, which is holding back sales…However, signed contracts have remained mostly steady in recent months, and properties sold faster in November. Therefore it’s highly possible the stark sales decline wasn’t because of sudden, withering demand.
…although Realtors® are adjusting accordingly to the Know Before You Owe initiative, the main takeaway so far has been the need for longer closing times. According to NAR’s Realtors® Confidence Index, 47 percent of respondents in November reported that they are experiencing a longer time to close compared to a year ago, up from 37 percent in October.”
I am not clear why these issues are not having the same dramatic impact on the sale of new homes.
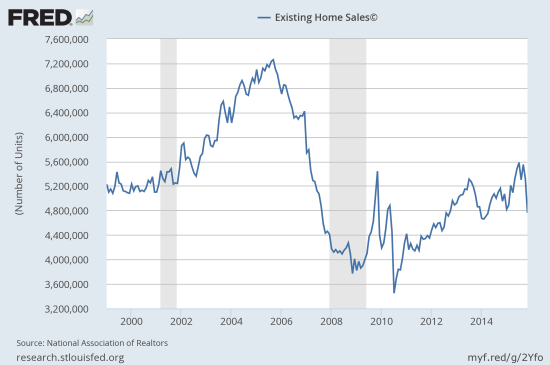
Source: National Association of Realtors, Existing Home Sales© [EXHOSLUSM495S], retrieved from FRED, Federal Reserve Bank of St. Louis, January 2, 2016.
I am taking a wait and see approach. If existing home sales do not soon stabilize, I will have to assume something bigger is amiss in the market. The inventory situation for existing homes is not as healthy as that for new homes. There is a 5.1-month supply of existing homes for sale. So existing home sales will not likely make a sharp rebound in the next month or two even with a resolution of the issue with closings.
As I have expected since June, new home buyers have still made no progress. In November, their share dropped to 30% from 31% in October.
Interestingly, all cash sales suddenly perked back up. This flies in the face of some bearish commentary I had seen which assumed the recent retreat of all cash sales marked a top in the market. Individual investors are still very active…
“Matching the highest share since January, all-cash sales rose to 27 percent of transactions in November (24 percent in October) and are also up from 25 percent a year ago. Individual investors, who account for many cash sales, purchased 16 percent of homes in November (also the highest since January), up both from 13 percent in October and 15 percent a year ago. Sixty-four percent of investors paid cash in November.”
Home Builder Confidence: The Housing Market Index– December, 2015
The Housing Market Index (HMI) dropped by a point in December. Each component of the HMI dropped slightly. Overall, confidence remains high for builders.
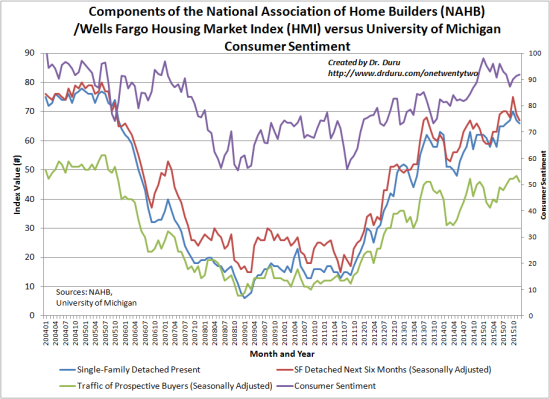
Source: The National Association of Home Builders (NAHB)
The traffic of prospective buyers is one small potential point of concern. This component seems to be flattening out while the other two still appear to be in the middle of healthy uptrends. Generally, builders do not seem to base their optimism on traffic and make their optimistic projections for sales 6-months out based on a host of other factors. Indeed, this component was the last to fall as the last housing bubble began to burst.
Parting thoughts
I do not pay much attention to aggregate price dynamics. Without context, we cannot know whether rising/dropping prices are good or bad for the housing market. Lower prices can stoke demand, higher prices can choke demand. Lower prices can signal collapsing demand, higher prices can reflect soaring demand. So, I mainly find prices interesting on a market-specific basis where context is easier to discern. On an aggregate basis, affordability is more interesting than average or median prices. While affordability continues to bounce at its lowest levels since the recession, housing remains remarkably more affordable than it has in a very long time. Rock-bottom interest rates are a large part of the affordability equation. The small uptick in rates coming from the Federal Reserve will NOT make a significant dent in affordability. The latest data point in the graph below comes from October, 2015.
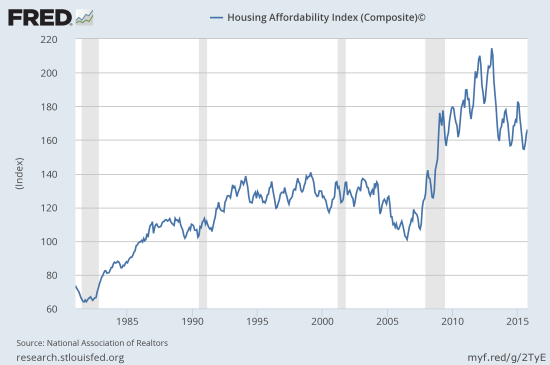
Source: National Association of Realtors, Housing Affordability Index (Composite)© [COMPHAI], retrieved from FRED, Federal Reserve Bank of St. Louis, January 2, 2016.
The iShares US Home Construction (ITB) finished the year with a 4.7% gain. This performance easily outpaced the 0.7% loss on the year experienced by the S&P 500 (SPY). More importantly, ITB has essentially gone nowhere since late February. ITB looks like a coiled spring at current levels awaiting the Spring selling season. I like ITB to at least rally back to the top of the range as part of the market’s anticipation of the Spring selling season, positive builder sentiment, and the on-going gain in housing starts. However, I suspect housing will have to put on an absolutely stellar performance to convince the market to take housing-related stocks to fresh breakout territory.
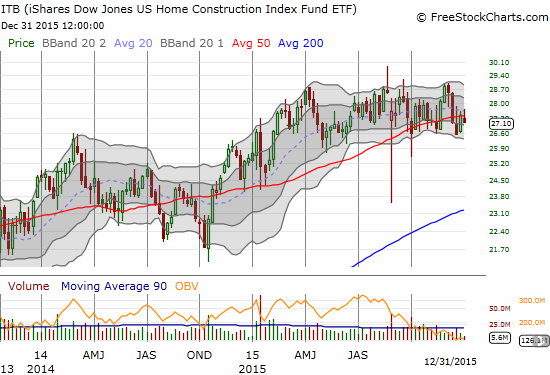
Source: FreeStockCharts.com
Be careful out there!
Full disclosure: long ITB call options