
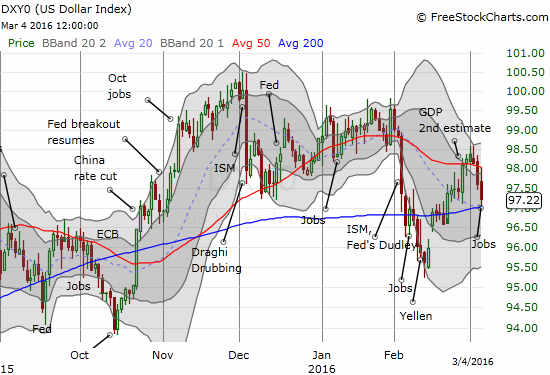
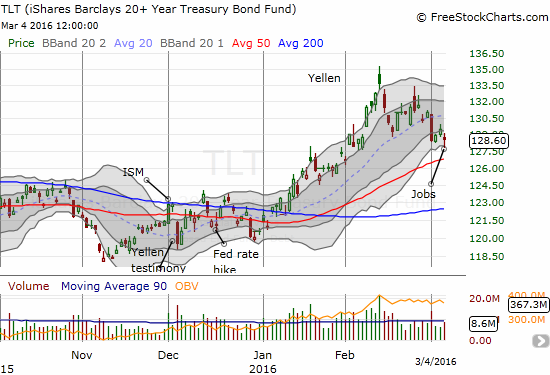
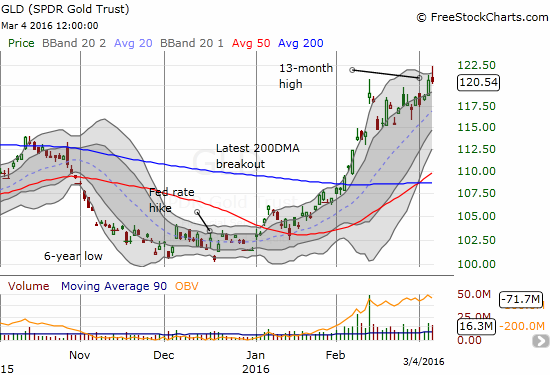
I have become accustomed to a relatively predictable reaction to moves in the market’s expectations for rate hikes from the U.S. Federal Reserve. Last week began in the wake of the market finally bringing its expectations for the next rate hike back into 2016. The cascade of impacts from there were predictable: a stronger U.S. dollar index (DXY0), a drop in iShares 20+ Year Treasury Bond (TLT), and a (slight) decline in SPDR Gold Shares (GLD).
Something a bit different happened this past Friday, March 4, 2016 after the U.S. reported its jobs numbers for February. Rate expectations were pulled into September as part of what is now a trend of earlier and earlier expectations for a rate hike.
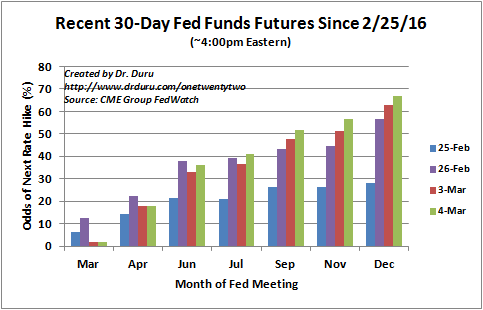
Source: CME Group FedWatch
Instead of strengthening during the week along with rate expectations, the U.S. dollar spent its time weakening. The index even closed the week retesting support at its 200DMA.
TLT dropped big to start the month. While it dipped on Friday in response to the jobs report, it bounced off its lower-Bollinger Band (BB) and failed to closed off the low of the week. I decided to use this dip to add to a tranche of call options on TLT. My trades here have simply played TLT’s strong uptrend for this year.
The SPDR Gold Shares (GLD) continued its resilience. GLD ROSE through the week and even went higher on Friday before fading into a slightly negative close. Given the surging rate expectations, I would have expected GLD to fall. I guess the dollar’s weakness helped gold stay aloft.
I am not sure yet what to make of this combination of events. So I am looking for confirmation of this change in behavior in the coming week. The Fed’s next monetary policy statement later in March should provide more clues.
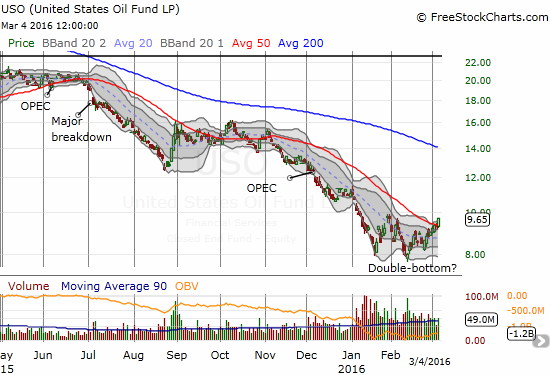
In the meantime, I am also looking at oil as the potential wildcard underpinning a changing landscape. On January 22, 2016, I claimed that the United States Oil (USO) looked like it was printing a bottom that should be more sustainable than the ones from 2015. On February 11, USO marginally violated that bottom but has increased steadily since then (along with the price of oil of course). I have to believe that growing confidence in the staying power of oil prices will ripple throughout financial markets in supporting the changing relationships I noted above.
Source of charts: FreeStockCharts.com
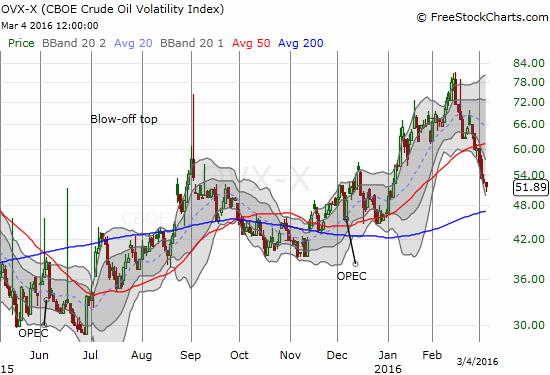
February 11th is important for a multitude of reasons (additional charts below):
- The CBOE Crude Oil Volatility Index (OVX) peaked.
- The volatility index, the VIX, last peaked after another failure at resistance from the intraday high from 2012.
- The U.S. dollar index last bottomed.
- GLD gapped up 4.0% in what looked like at the time the climax of a near parabolic run-up.
- TLT peaked at a 1-year high.
- The Australian dollar (FXA) hit a 3 1/2 year low against the Japanese yen (FXY)
- The S&P 500 (SPY) hit a 2-year low and printed its last oversold period which lasted just 1-day. The rally from this low has marked a distinct change in market sentiment.
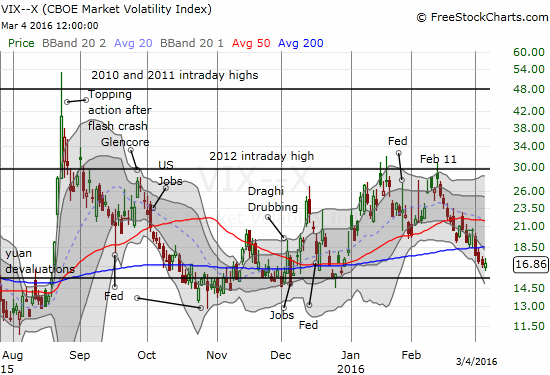
And what happened on February 11th? A Fed-related event of course. On February 10th, Chair Janet Yellen began a 2-day tour of Congress to provide the Fed’s semi-annual testimony on monetary policy. At the time, Yellen failed to provide the typical anti-volatility reassurances. I even braced for a more protracted oversold period based on the market’s reaction. This 2-day event generated a marked change in trend in so many important market indicators and thus provides yet another powerful reminder of the necessity for traders to pay attention to the market’s reactions to the pronouncements and actions of central bankers. I know this circus is endlessly exhausting, but it is our new and enduring reality. So lets collectively brace for the Fed’s next pronouncements on March 16th.
Be careful out there!
Full disclosure: long and short currencies against the U.S. dollar, long GLD, long TLT call options, short USO call and put options, long USO call options