
(T2108 measures the percentage of stocks trading above their respective 40-day moving averages [DMAs]. It helps to identify extremes in market sentiment that are likely to reverse. To learn more about it, see my T2108 Resource Page. You can follow real-time T2108 commentary on twitter using the #T2108 hashtag. T2108-related trades and other trades are occasionally posted on twitter using the #120trade hashtag. T2107 measures the percentage of stocks trading above their respective 200DMAs)
T2108 Status: 85.9%
T2107 Status: 35.7%
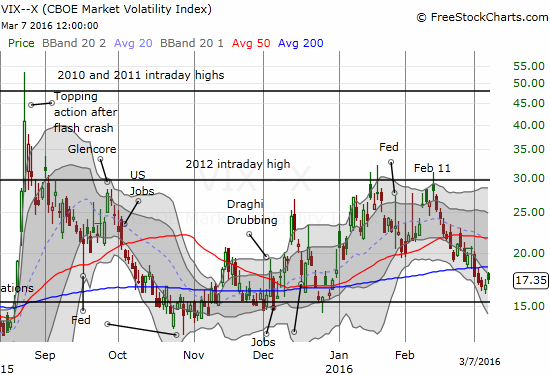
VIX Status: 17.4
General (Short-term) Trading Call: cautiously bullish
Active T2108 periods: Day #17 over 20%, Day #16 over 30%, Day #13 over 40%, Day #10 over 50%, Day #6 over 60%, Day #5 over 70%, Day #3 over 80% (overbought)
Commentary
Could be a big day for $CAT. Trading above 200DMA. Hasn't done that since around Nov, 2014.
— Dr. Duru (@DrDuru) March 7, 2016
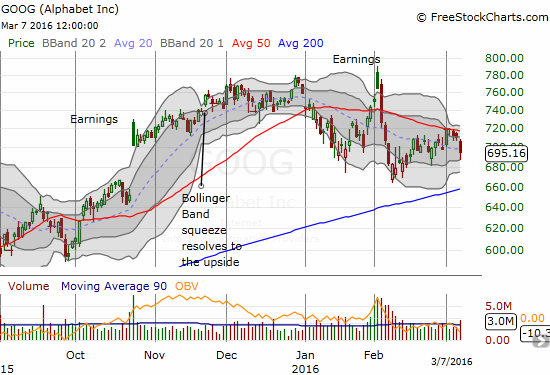
In the flip side, $GOOG looks like it is confirming 50DMA resistance. On watch.
— Dr. Duru (@DrDuru) March 7, 2016
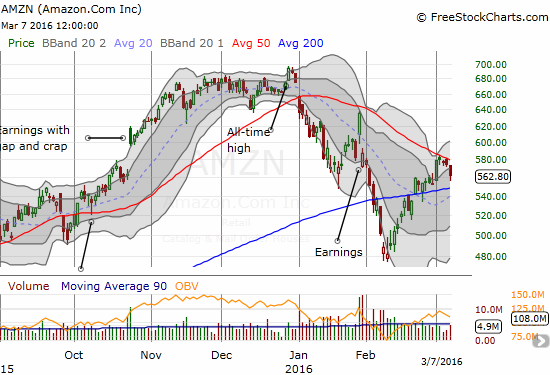
Ditto $AMZN. Stock has tried now 4 days straight to break 50DMA resistance…to no avail.
— Dr. Duru (@DrDuru) March 7, 2016
Many of the speculative run-ups I described in the last T2108 Update continued to start trading this week. T2108, the percentage of stocks trading above their respective 40-day moving averages (DMAs) managed to eek out yet another daily gain to close at 85.9%. T2107, the percentage of stocks trading above their respective 200DMAs, further supported the on-going bullish mood with its fifth straight gain to close at 35.7%. T2107 has declined only TWO days since the February 11th bottom at oversold trading conditions; T2108 has experience three down days over this span. The S&P 500 (SPY) once again obscured the underlying bullishness, this time with an imperceptible 0.09% gain.
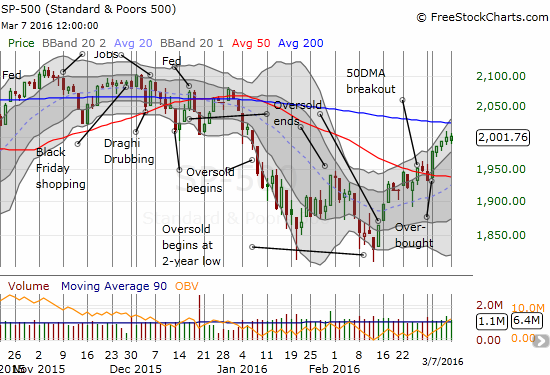
The volatility index even gained for a second day in a row although it faded strongly off intraday highs.
The big obstacle for the market on the day was the simultaneous failure of the big internet stocks to break through resistance at their respective 50DMAs. These same stocks had led market sentiment and pushed the indices despite underlying technical weakness last year. Now, these big boys are failing to carry their weight. The parallel nature of these failures is eye-catching…
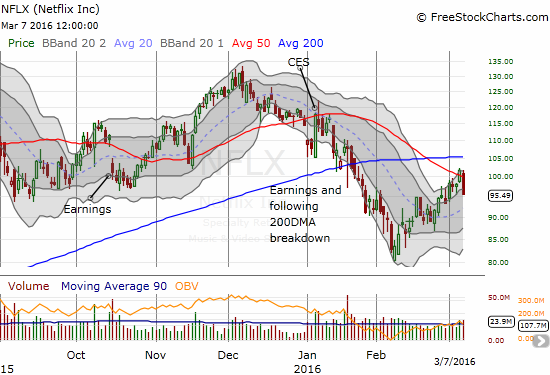
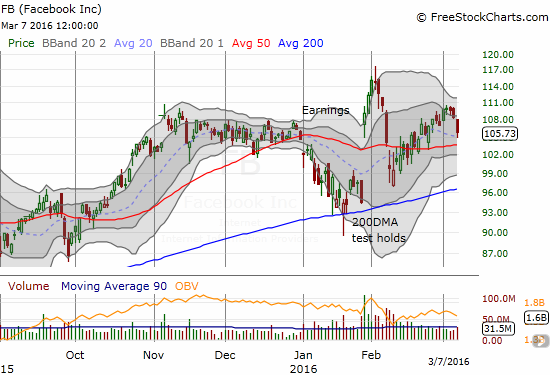
(As a reminder, I wrote about Facebook as “full bull” on February 17, 2016).
I am startled to see these (former) leaders all struggle in the past several days while the underlying bullishness of the market marches forward. It is of course very possible that traders are taking profits in these names to fund speculation elsewhere in the market. If these market leaders continue to wane from 50DMA resistance, and especially if some start to breach 200DMA support, I will have to raise the same yellow flag I would raise if T2108 suddenly started to wane. I am particularly keen to see whether these stocks start to trade inversely to many of the stocks experiencing strong run-ups right now, especially the commodities-related stocks.
Stay tuned!
— – —
For readers interested in reviewing my trading rules for T2108, please see my post in the wake of the August Angst, “How To Profit From An EPIC Oversold Period“, and/or review my T2108 Resource Page.
Reference Charts (click for view of last 6 months from Stockcharts.com):
S&P 500 or SPY
U.S. Dollar Index (U.S. dollar)
EEM (iShares MSCI Emerging Markets)
VIX (volatility index)
VXX (iPath S&P 500 VIX Short-Term Futures ETN)
EWG (iShares MSCI Germany Index Fund)
CAT (Caterpillar).
IBB (iShares Nasdaq Biotechnology).
Daily T2108 vs the S&P 500
")
Black line: T2108 (measured on the right); Green line: S&P 500 (for comparative purposes)
Red line: T2108 Overbought (70%); Blue line: T2108 Oversold (20%)
Weekly T2108

*All charts created using freestockcharts.com unless otherwise stated
The charts above are the my LATEST updates independent of the date of this given T2108 post. For my latest T2108 post click here.
Related links:
The T2108 Resource Page
Expanded daily chart of T2108 versus the S&P 500
Expanded weekly chart of T2108
Be careful out there!
Full disclosure: short FB, long FB call options, long CAT put options