
(T2108 measures the percentage of stocks trading above their respective 40-day moving averages [DMAs]. It helps to identify extremes in market sentiment that are likely to reverse. To learn more about it, see my T2108 Resource Page. You can follow real-time T2108 commentary on twitter using the #T2108 hashtag. T2108-related trades and other trades are occasionally posted on twitter using the #120trade hashtag. T2107 measures the percentage of stocks trading above their respective 200DMAs)
T2108 Status: 59.3%
T2107 Status: 24.0%
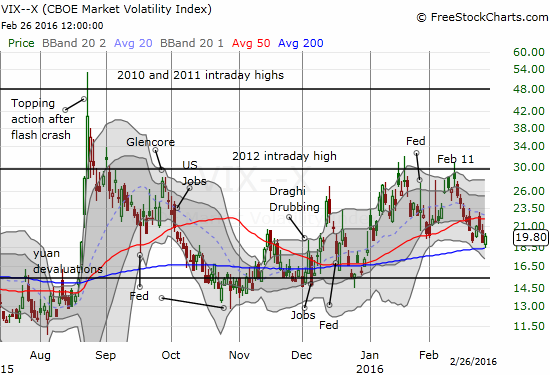
VIX Status: 19.8
General (Short-term) Trading Call: bullish
Active T2108 periods: Day #9 over 20%, Day #8 over 30%, Day #5 over 40%, Day #2 over 50% (ending 55 days below 50%) (overperiod), Day #72 under 60% (underperiod), Day #413 under 70%
Commentary
A little over two weeks ago, T2108, the percentage of stocks trading above their respective 40-day moving averages (DMAs), sank back into oversold territory. At the time, I braced for a repeat of the angst from January’s extended trip into oversold territory. I even gave a heavy to discount to the continued inability of the volatility index, the VIX, to break critical resistance. Fortunately, I have my trading rules to follow to navigate turbulent periods. With oversold conditions still a recent memory, T2108 is amazingly already knocking on the door at overbought territory with a close at 59.3%. T2108 has not been this high since November 6, 2015.
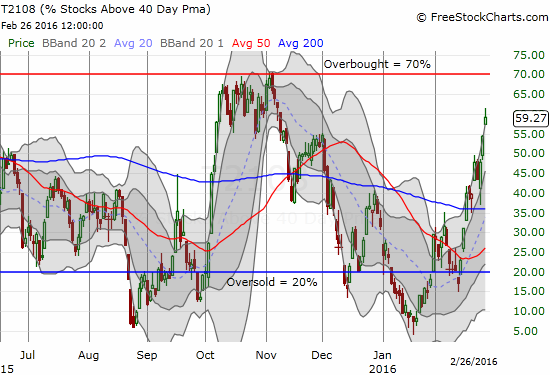
Of course, the moving averages of a lot of stocks have significantly dropped given the technical deterioration since August and the battering of all the selling since August and especially year-to-date. I am sure in many cases, stocks are limping across declining 40DMAs. Still, a rising T2108 is much better than a dropping one. The rise is a marker of improving health whether it confirms an up-trend and rally or whether it suggests that stocks are progressing through a healing process. At 59%, T2108 indicates the healing process is underway across a broad swath of the market.
The speed of T2108’s recovery is well ahead of the bounce in the S&P 500 (SPY) from oversold conditions. An example of this divergence resurfaced Friday. T2108 jumped from 54.4% to 59.3% while the S&P 500 remained flat and failed to provide follow-through on Thursday’s important 50DMA breakout.
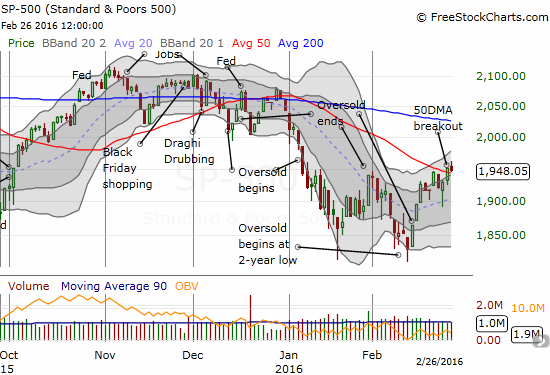
The index needs the follow-through breakout as a way to confirm the W-bottom from the intraday lows of January and February. On such a confirmation, I will next target the declining 200DMA as the next upside target.
T2108’s ability to race ahead of the pace of the S&P 500 is not just a divergence, but also it looks like a bullish divergence. I had an interesting back-and-forth with a reader on this topic that forced me to think about how to formalize this notion better than I have in the past.
First, I remind readers of the more powerful bearish divergence. Last October/November, I pointed out how T2108 failed to budge much despite the S&P 500’s on-going rally. That rally was a powerful one that launched the S&P 500 from a vicious combination of oversold periods (starting with the August Angst) and culminating in a historic 8.3% gain for October. As the divergence in performance wore on, I got increasingly wary about the health of the rally. Like other technicians, I referred to an unhealthy imbalance where a select few large market cap stocks seemed to drive the bulk of the gains in the index. These few names could drive the index higher even as 30-40% of stocks stubbornly failed to clear the 40DMA hurdle day-after-day. Sure enough, the S&P 500 soon broke down.
On November 2nd, I wrote “The S&P 500 Stairsteps Ever Higher and STILL Avoids Overbought Status” and warned:
“Despite this strong and bullish breakout, I cannot flip the trading bias from neutral to bias. T2108, my favorite indicator, closed at 67.5%. So it is STILL churning below overbought territory and indicating that the on-going rally is not able to push new stocks over the hump. This churn is closing in on one month in duration. I am patiently waiting to see how the market behaves once this occurs: will the market finally lose momentum and reverse or will it get new life and launch into one of those epic oversold rallies?”
Four days later, I wrote “A Toppy Feeling In the Market Even As Individual Stocks Shine” as T2108 continued to stubbornly churn just below overbought status. I made the bearish case as one of divergence that was not likely to last much longer:
“I am now ready to conclude that T2108 will NOT broach overbought levels anytime soon. The churn for the past month means that despite the impressive advance of the S&P 500 (SPY), buyers are having trouble pushing additional stocks over the hump. The advancing tide has failed to lift more boats for at least a month…
The sharpening divergence between T2108 and the S&P 500 is very surprising to me. With the market finally gearing up for an imminent rate hike, I am now inclined to interpret this divergence as bearish. I flipped the trading call from neutral to bearish. My major caveat is that I still do not think it is worth getting aggressive on any shorts until the S&P 500 closes below 200DMA support. At this market juncture, it will take such a breakdown to confirm my bearish trading call.”
Three days later, the confirming breakdown occurred. I covered this key confirmation in “Market Momentum Waning.”
Given the powerful nature of bearish divergence, I am greatly interested in formalizing the notion of a bullish divergence.
When the S&P 500 launched out of oversold conditions earlier this month, the index and T2108 were well in sync: three straight days of very strong buying. That joint rally was a good sign because it indicataed a broad participation in the bounce. Buyers found attractive discounts across the market; the rally was not just shorts rushing to cover positions. T2108 soared from 17 to 30%. The S&P 500 gained an impressive 5.3%.
Over the 7 trading days since that 3-day rally, the index has only managed to gain 1.1% with 3 of the 7 days delivering upside. T2108 has registered 4 days of gains and has moved from 40% to 59%. The S&P 500 is essentially no longer reflecting the broadbased nature of the rally. Individual stocks are continuing to repair their technical positioning even as the S&P 500 slows down. At some point, enough stocks will heal such that the S&P 500 index will continue to rise. Without evidence suggesting the contrary, I consider this a bullish divergence because of the potential for underlying buying pressure to translate into a resumption of momentum for the S&P 500.
This concept of bullish divergence as a continuation is trickier than a bullish divergence as a marker of a bottom. Continuation does not provide built-in support or resistance. It just so happens that the S&P 500 is trading around its 50DMA as a marker for resistance and a launching pad for confirmation of bullishness.
Note that this bullish divergence does not depend on whether 40DMAs are declining or increasing. What matters most is that T2108 continue to gain or at least avoid steep downside. The longer T2108 stays aloft, the more healing occurs, and the better behaved the moving averages become. When these moving averages start to turn, momentum decidedly shifts to the upside. The potential for this momentum shift to create a sustained rally makes the next rendezvous with the overbought threshold very critical. If T2108 fails to cross into overbought status over a long period of time, I will have to assume momentum is waning again.
Every retest of overbought levels becomes more and more historic. T2108 has gone an incredible 413 trading days without crossing the overbought threshold at 70%. T2108 was last overbought in early July, 2014. The S&P 500 has lost 1.9% over that time.
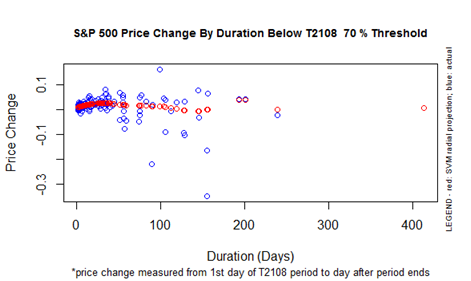
The above chart shows that not only is this 70% underperiod an anomaly and a huge outlier, but also it is a historic record for the available data. I will not even offer a projection for the S&P 500’s likely performance when (if?) T2108 finally goes overbought again.
Over in the currency market, the Australian dollar (FXA) versus the Japanese yen (JPY) is STILL not confirming bullishness. The currency pair remains trapped in the trading range I have showed over and over again. I treat this churn as the biggest caveat.
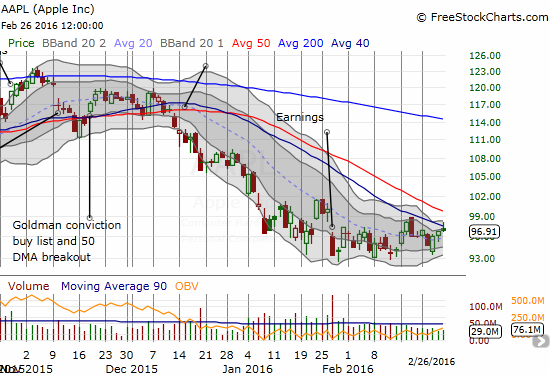
The volatility index made a bid to hold 200DMA support. It is a secondary caveat given it appears to be in the middle of a definitive breakdown. (The reader I mentioned earlier should be quick to point out the possibility that AAPL could just stumble across its 40DMA just by the line falling below current prices. Forty days ago, AAPL was around 108. In the coming days, these large numbers from 40 days ago will drop from the moving average and get replaced with much lower numbers in the high 90s.).
Speaking of churn, Apple (AAPL) continues to churn along its bottom. AAPL is clearly one of the big cap stocks that is not helping the S&P 500 lift along with T2108. I have added a dark blue line for the 40DMA. Note how AAPL closed the week neatly fading from that important line. AAPL has not yet even contributed to the lift in T2108. Even when AAPL conquers its 40DMA, the declining 50DMA looks like ominous overhead resistance.
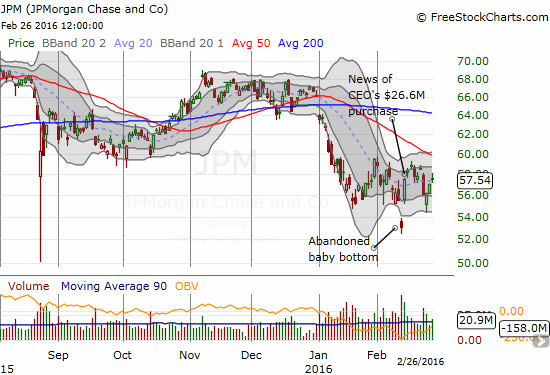
There are a few key trades I have made in the past two days. Most importantly, my call options on JP Morgan Chase (JPM) hit a double. Since the stock was “close enough” to the top of the trading range I targeted, I decided to sell and lock in profits. The chart below shows that “the JPM Bottom” remains well intact.
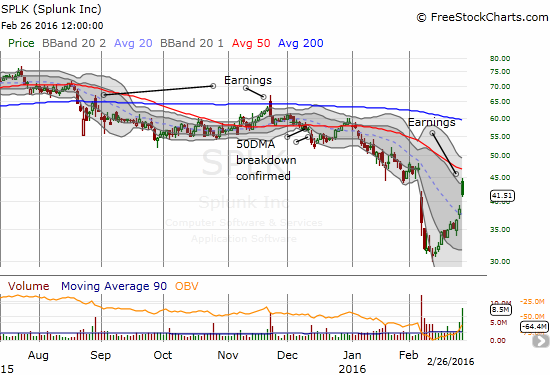
Splunk (SPLK) reported earnings and started Friday with a 14% gap up and ended the day with a 7.7% gain at the close. Earlier this month, I pointed out how SPLK plunged in sympathy with a disastrous earnings report from Tableau (DATA). The move looked like an over-reaction, and I flipped bullish. I did not hold the position through earnings: I did not want to take on the risk. Seeing SPLK stop short of closing the entire post-DATA gap, I decided to get back on the bearish side and fade the stock. After all, the rally was likely mostly about relief than inherently stellar results. The gambit worked, and I closed out the trade before the close.
I will be watching closely to see how SPLK behaves in the post-earnings period. A close of the gap up will be a very bearish sign given how SPLK faded from the previous two earnings. Similarly, a new post-earnings high will be very bullish, but, there it is again, a declining 50DMA looms overhead to present buyers a major challenge. (I am still holding my shares in DATA purchased after the post-earnings angst).
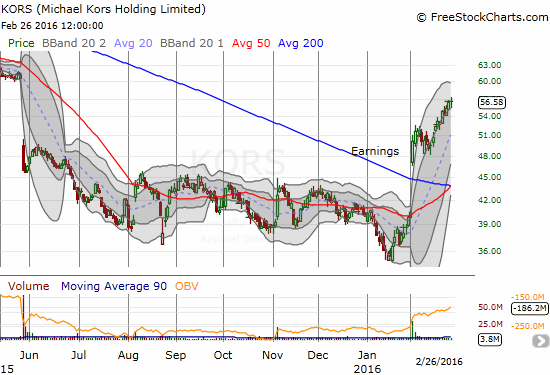
Finally, earlier this week I closed out my position in Coach (COH). Another luxury brand, Michael Kors Holding (KORS), produced an even more spectacular breakout in a move that looks like a major turn-around in sentiment. I am including this chart because of the fantastic poetry in the stock’s ability to inch its way along the first upper-Bollinger Band (BB). This is a stock that traders should buy on the dips until the stock dips below resistance – that is my plan anyway. The earnings monster breakout above BOTH 50 and 200DMA resistance is VERY bullish. I am guessing the major gap down from earnings in May, 2015 will fill in due time. KORS is the kind of stock making progress while big guys like AAPL fail to do their part in pushing the S&P 500 upward…
— – —
For readers interested in reviewing my trading rules for T2108, please see my post in the wake of the August Angst, “How To Profit From An EPIC Oversold Period“, and/or review my T2108 Resource Page.
Reference Charts (click for view of last 6 months from Stockcharts.com):
S&P 500 or SPY
U.S. Dollar Index (U.S. dollar)
EEM (iShares MSCI Emerging Markets)
VIX (volatility index)
VXX (iPath S&P 500 VIX Short-Term Futures ETN)
EWG (iShares MSCI Germany Index Fund)
CAT (Caterpillar).
IBB (iShares Nasdaq Biotechnology).
Daily T2108 vs the S&P 500
")
Black line: T2108 (measured on the right); Green line: S&P 500 (for comparative purposes)
Red line: T2108 Overbought (70%); Blue line: T2108 Oversold (20%)
Weekly T2108

*All charts created using freestockcharts.com unless otherwise stated
The charts above are the my LATEST updates independent of the date of this given T2108 post. For my latest T2108 post click here.
Related links:
The T2108 Resource Page
Expanded daily chart of T2108 versus the S&P 500
Expanded weekly chart of T2108
Be careful out there!
Full disclosure: long SSO call options, long SSO shares, long SVXY shares, short AUD/JPY, long DATA