
(T2108 measures the percentage of stocks trading above their respective 40-day moving averages [DMAs]. It helps to identify extremes in market sentiment that are likely to reverse. To learn more about it, see my T2108 Resource Page. You can follow real-time T2108 commentary on twitter using the #T2108 hashtag. T2108-related trades and other trades are occasionally posted on twitter using the #120trade hashtag. T2107 measures the percentage of stocks trading above their respective 200DMAs)
T2108 Status: 47.9%
T2107 Status: 21.8%
VIX Status: 20.7
General (Short-term) Trading Call: bullish
Active T2108 periods: Day #7 over 20%, Day #6 over 30%, Day #3 over 40% (overperiod), Day #55 below 50%, Day #70 under 60%, Day #411 under 70%
Commentary
T2108 closed exactly where I left it two days ago: 47.9%. The S&P 500 (SPY) closed lower than where I left it two days ago: 1945.50 versus 1929.80. This is technically a small bullish divergence. The on-going bounce from oversold conditions continues to experience broad participation even if the leaders that drive the S&P 500 are not always cooperating.
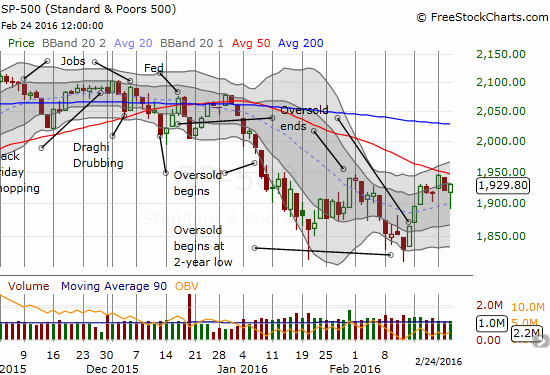
The close-up chart above shows how the S&P 500 (SPY) has so far failed to conquer overhead resistance at a declining 50-day moving average (DMA). The selling on the day was deep enough at the lows to make resistance look confirmed. However, the selling lasted just over 30 minutes. Buyers stepped in around rising 20DMA support which also happened to coincide with the round number 1900. Buyers never looked back as they closed the index at its highs on the day. This was a very important and critical reversal and statement by buyers. It turned the odds further in their favor. The overhead resistance from the 50DMA looks a little less ominous now.
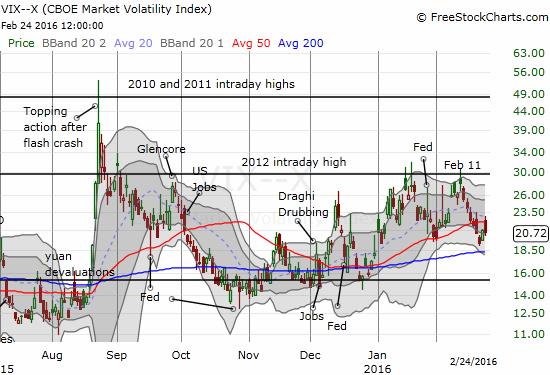
The volatility index, the VIX, worked in reverse. For a breif moment, the VIX traded above 50DMA resistance, but it could not hold that level. Now, the 50DMA looks like stiffer resistance.
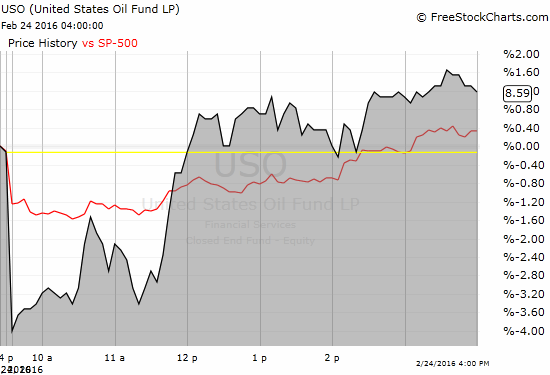
Once again, market observers looked to oil to explain the day’s moves in stocks. On a closing basis, oil did seem to drive the action. An intraday view shows a much more nuanced picture. Oil inventories were reported at 10:30am Eastern. Oil spiked higher and then quickly reversed those initial gains. The S&P 500 remained mostly flat through that entire move. As oil took off for good, the S&P 500 also made a more definitive move off its intraday low. From there, the index mainly moved higher into the close whereas oil was much more choppy. There was even a stretch from 1 to 2pm where oil glided downward while the S&P 500 continued higher. In other words, contrary to assumptions, traders cannot automatically look to oil as a guide for trading stocks – at least not based on today’s action. I use United States Oil (USO) as a proxy for intraday oil prices.
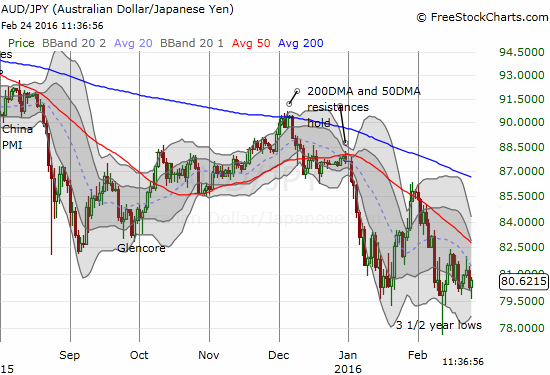
The Japanese yen (FXY) stands out as a major point of concern. Its stubborn strength defies all bullish signals from stocks. In particular, the Australian dollar (FXA) versus the Japanese yen has yet to confirm the current bullish rally off oversold trading conditions.
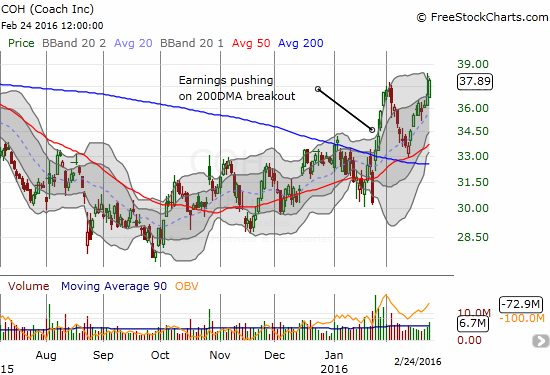
Early in the day, I decided to sell my call options on Coach (COH). I discussed this trade last week in a T2108 Update. For today, I was impressed by the relative strength but assumed COH would soon give in to the selling at the time. Buying volume over the past week or so has been very poor. Not only did I fail to anticipate the day’s reversal, but also COH ended the day with very good buying volume. The stock is now on the edge of a very bullish breakout.
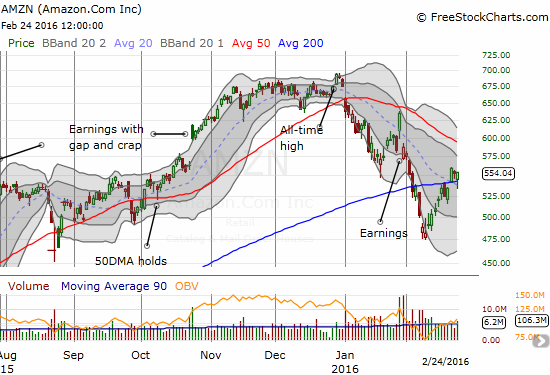
And just like that, $AMZN has given up 200DMA support again.
— Dr. Duru (@DrDuru) February 24, 2016
Soon after I tweeted the above, AMZN stopped selling off. I took that stabilization as a sign to double down on my call options and was rewarded. Time is running out on this position though!
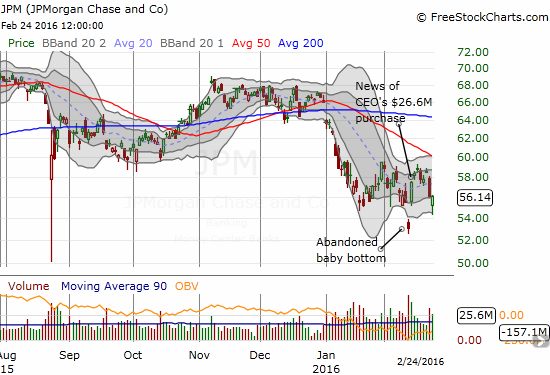
$JPM giving up bullish tidings as it starts to close the gap up from Feb 12th.
— Dr. Duru (@DrDuru) February 24, 2016
Soon after tweeting about the sell-off of JP Morgan Chase (JPM) into its bullish gap, it suddenly occurred to me that I needed to treat this sell-off as a buying opportunity. The last oversold period ended with what I called a “JP Morgan Bottom.” If this call remains valid then the gap should remain intact. I quickly loaded up on call options and was rewarded as JPM soon turned around and followed the market into a strong close. Note that I am still holding onto put options on Financial Select Sector SPDR ETF (XLF), so I have a layered hedge going with the addition of the JPM position. I am targeting JPM for a return toward the top of its current trading range.
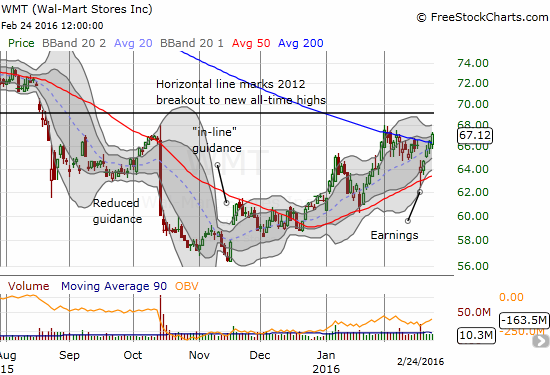
My fascination with Wal-Mart Stores (WMT) continues. I failed to take advantage of this latest successful test of 50DMA support: the call options I wanted never got cheap enough. Now, WMT is on the edge of a major breakout as it managed to close above what I thought might be stiff resistance at its 200DMA. Needless to say, the complete reversal of post-earnings losses is a very bullish sign for the stock.
So while buyers still have to confirm bullishness by pushing the S&P 500 over its 50DMA hump and getting AUD/JPY revved up, there are confirming signs in some important individual stocks. The major reversal of intraday losses in the market and even JPM’s ability to hold support are particularly important signs. Having said all that, at the time of writing, the Shanghai Composite (SSEC) closed down on the day with a 6% loss. =gulp=
— – —
For readers interested in reviewing my trading rules for T2108, please see my post in the wake of the August Angst, “How To Profit From An EPIC Oversold Period“, and/or review my T2108 Resource Page.
Reference Charts (click for view of last 6 months from Stockcharts.com):
S&P 500 or SPY
U.S. Dollar Index (U.S. dollar)
EEM (iShares MSCI Emerging Markets)
VIX (volatility index)
VXX (iPath S&P 500 VIX Short-Term Futures ETN)
EWG (iShares MSCI Germany Index Fund)
CAT (Caterpillar).
IBB (iShares Nasdaq Biotechnology).
Daily T2108 vs the S&P 500
")
Black line: T2108 (measured on the right); Green line: S&P 500 (for comparative purposes)
Red line: T2108 Overbought (70%); Blue line: T2108 Oversold (20%)
Weekly T2108

*All charts created using freestockcharts.com unless otherwise stated
The charts above are the my LATEST updates independent of the date of this given T2108 post. For my latest T2108 post click here.
Related links:
The T2108 Resource Page
Expanded daily chart of T2108 versus the S&P 500
Expanded weekly chart of T2108
Be careful out there!
Full disclosure: long SSO call options, long SSO shares, long SVXY shares, long AMZN call options, short AUD/JPY, long IAC put options, short USO call and put options and long USO call options
I question whether S&P down 0.8% but T2108 flat is “technically a bullish divergence”. I believe there are only two ways a broad average can fall while T2108 does not:
1) the average is based on significantly different stocks than T2108
2) the 40 DMAs of T2108’s stocks are on average falling
We know the S&P 500 is not the same as , but overlaps and is similar to, the NYSE non-financials that make up T2108.
So I think you need to consider whether #2 is sufficient to explain the divergence. If so, it ain’t bullish, at least short term.
True. I have yet to formalize the notion of “divergence” and sometimes use the term loosely. But if 40DMAs are falling and the stocks are not falling below them, that is still a positive in the relative sense. At some point, the DMA should slow its descent.
So I will try to be more precise next time!
Given the market’s performance today (Feb 25) as a follow-up, I still think there is something to be said about T2108 exhibiting stronger behavior than the S&P 500. The market is acting like a bullish divergence is indeed in place.