
(T2108 measures the percentage of stocks trading above their respective 40-day moving averages [DMAs]. It helps to identify extremes in market sentiment that are likely to reverse. To learn more about it, see my T2108 Resource Page. You can follow real-time T2108 commentary on twitter using the #T2108 hashtag. T2108-related trades and other trades are occasionally posted on twitter using the #120trade hashtag. T2107 measures the percentage of stocks trading above their respective 200DMAs)
T2108 Status: 67.5%
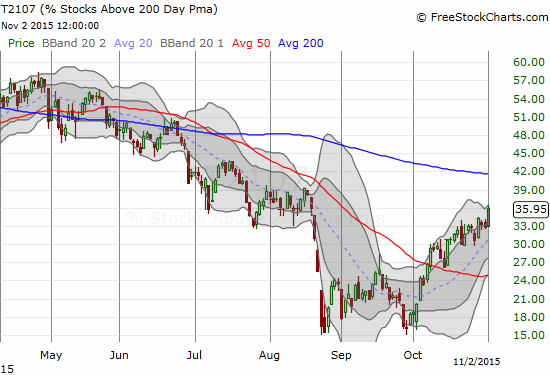
T2107 Status: 36.0% (finally reversed all of its August angst)
VIX Status: 14.2
General (Short-term) Trading Call: neutral
Active T2108 periods: Day #22 over 20%, Day #21 over 30%, Day #21 over 40%, Day #19 over 50%, Day #4 over 60% (overperiod), Day #336 under 70% (underperiod)
Reference Charts (click for view of last 6 months from Stockcharts.com):
S&P 500 or SPY
SDS (ProShares UltraShort S&P500)
U.S. Dollar Index (volatility index)
EEM (iShares MSCI Emerging Markets)
VIX (volatility index)
VXX (iPath S&P 500 VIX Short-Term Futures ETN)
EWG (iShares MSCI Germany Index Fund)
CAT (Caterpillar).
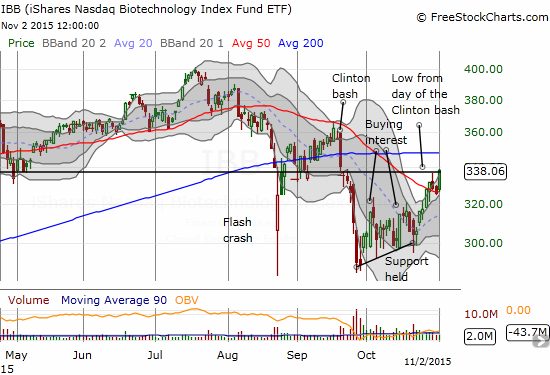
IBB (iShares Nasdaq Biotechnology).
Commentary
The S&P 500 (SPY) started November with another strong showing as the index picks up where it left off with October’s extraordinary performance. It closed with a 1.2% gain and a level last seen during the heights of August. Incredibly, the index can now see fresh all-time closing highs just over the horizon (2130.82)…
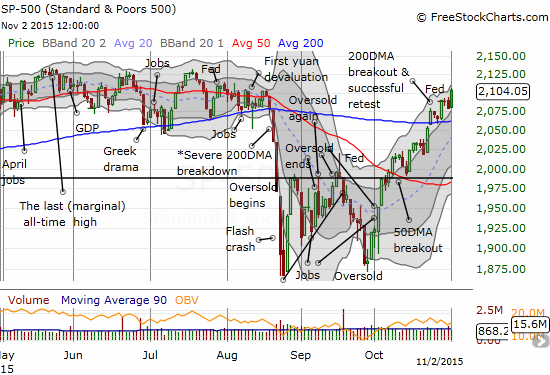
Despite this strong and bullish breakout, I cannot flip the trading bias from neutral to bias. T2108, my favorite indicator, closed at 67.5%. So it is STILL churning below overbought territory and indicating that the on-going rally is not able to push new stocks over the hump. This churn is closing in on one month in duration. I am patiently waiting to see how the market behaves once this occurs: will the market finally lose momentum and reverse or will it get new life and launch into one of those epic oversold rallies?
T2107, the percentage of stocks trading above their respective 200DMAs, is more interesting. While T2108 has stalled, T2107 has marched along with the S&P 500. It is a slower moving index that has just now reversed all the angst from August. At 36.0%, T2107 is at a 2+ month high. Left in the rearview mirror are a W-bottom and a 50DMA breakout that defines the end of a primary downtrend.
The volatility index, the VIX, continues along its own path of churn. It continues to trade just below the 15.35 pivot. In this position, it is not providing any clues to future direction. The VIX’s stasis mainly confirms the market’s general state of contentment. Oh how the August Angst is such a distant memory!
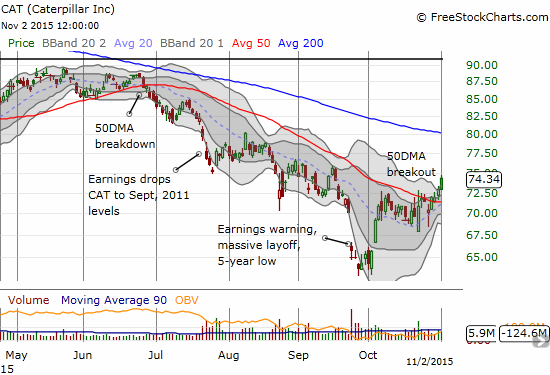
Caterpillar (CAT) is one of the most bullish developments among the stocks I follow. As readers know, I like to buy put options against CAT as a hedge on bullishness. When CAT is powering higher, I consider it a confirmation of bullishness. I blinked and suddenly realized that CAT broke out above its 50DMA and is now following through.
Some additional charts to consider while waiting for resolution of this tap dance with overbought status…
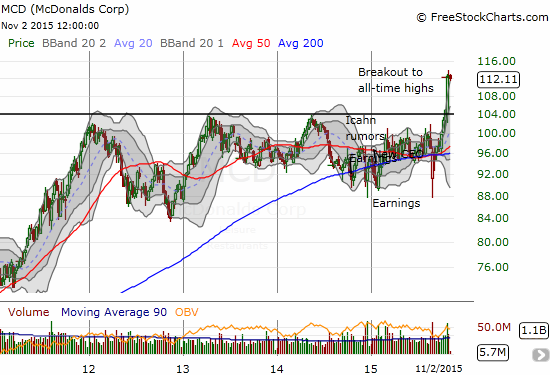
My bonus chart is McDonald’s. A little over a year ago I suggested accumulating shares of McDonald’s to take advantage of all the negativity surrounding the venerable chain at the time. It was very fashionable to talk about how Millennials abandoned MCD. The menu was stale and unappealing for the more hip youth of today. Behind the times. Etc, etc…One new CEO later and here is MCD making a very bullish breakout to new all-time highs…
Daily T2108 vs the S&P 500
")
Black line: T2108 (measured on the right); Green line: S&P 500 (for comparative purposes)
Red line: T2108 Overbought (70%); Blue line: T2108 Oversold (20%)
Weekly T2108

*All charts created using freestockcharts.com unless otherwise stated
The charts above are the my LATEST updates independent of the date of this given T2108 post. For my latest T2108 post click here.
Related links:
The T2108 Resource Page
Expanded daily chart of T2108 versus the S&P 500
Expanded weekly chart of T2108
Be careful out there!
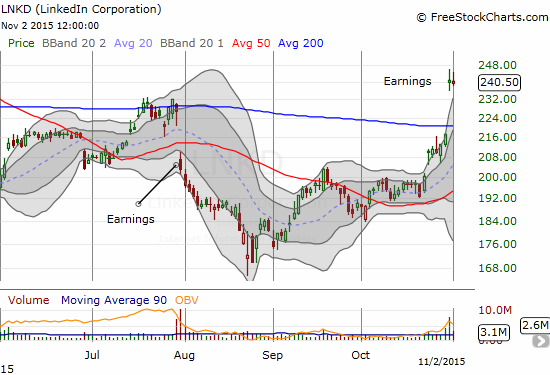
Full disclosure: long CAT, long LNKD call spread, long MCD