
(T2108 measures the percentage of stocks trading above their respective 40-day moving averages [DMAs]. It helps to identify extremes in market sentiment that are likely to reverse. To learn more about it, see my T2108 Resource Page. You can follow real-time T2108 commentary on twitter using the #T2108 hashtag. T2108-related trades and other trades are occasionally posted on twitter using the #120trade hashtag. T2107 measures the percentage of stocks trading above their respective 200DMAs)
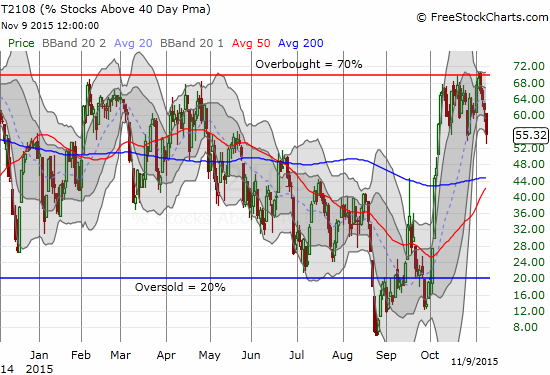
T2108 Status: 55.3%
T2107 Status: 30.9%
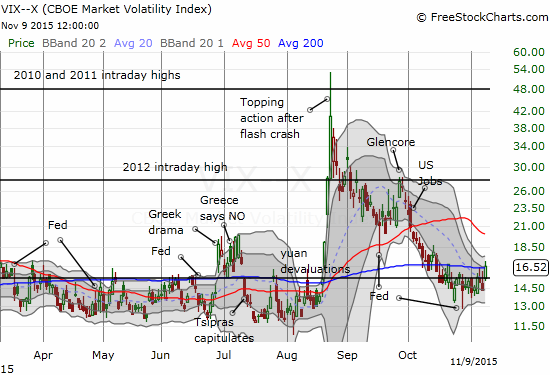
VIX Status: 16.5
General (Short-term) Trading Call: slightly bearish
Active T2108 periods: Day #27 over 20%, Day #26 over 30%, Day #26 over 40%, Day #24 over 50% (overperiod), Day #1 under 60% (ending 8 days over 60%) (underperiod), Day #341 under 70%
Reference Charts (click for view of last 6 months from Stockcharts.com):
S&P 500 or SPY
SDS (ProShares UltraShort S&P500)
U.S. Dollar Index (volatility index)
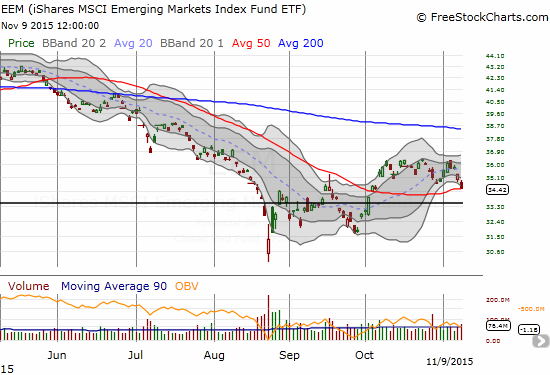
EEM (iShares MSCI Emerging Markets)
VIX (volatility index)
VXX (iPath S&P 500 VIX Short-Term Futures ETN)
EWG (iShares MSCI Germany Index Fund)
CAT (Caterpillar).
IBB (iShares Nasdaq Biotechnology).
Commentary
I made the case in the last T2108 Update for a bearish turn in the stock market. Today, Monday, November 9, 2015, started a confirmation process for that change in outlook. T2108 closed out the day at 55.3% and is retesting the low point of what has become a month-long range. A breakdown serves as a bearish confirmation. If T2108 bounces again from here, I will back down a bit on my bearish trading call.
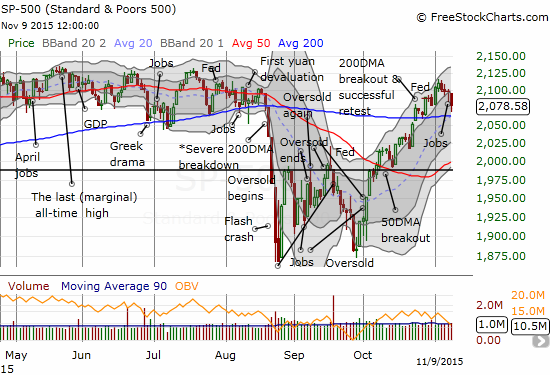
The S&P 500 (SPY) is also facing its own important retest of support. The index fell almost 1%, got back in sync with T2108, dropped out of the primary uptrend channel, and came within a “hair” of retesting 200DMA support.
The volatility index, the VIX, added its own stamp of approval for more bearish tidings. It closed above the 15.35 pivot. This pivot has held for almost a month. The VIX closed cleanly above the pivot for the first time since October 21st.
So momentum is waning from the stock market, and the waiting game continues for final confirmation – a 200DMA breakdown for the S&P 500.
In the last T2108 Update, I flipped bearish on the market but provided a lot of bullish charts. Time for some more bearish ones.
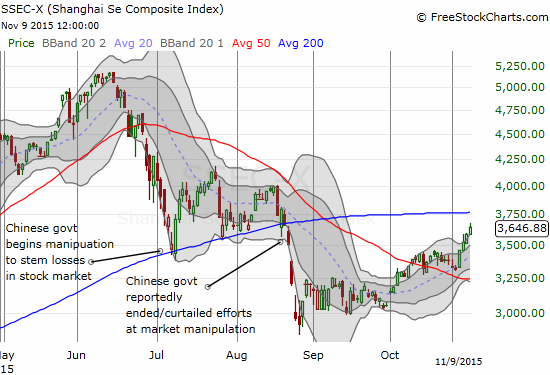
And just because I have not posted a chart of the Shanghai Stock Exchange Composite Index (SSEC) in very long time, here is a reminder that trading conditions in China actually continue to improve ever so steadily. The last four days in particular have provided a very strong bounce off 50DMA support.
Daily T2108 vs the S&P 500
")
Black line: T2108 (measured on the right); Green line: S&P 500 (for comparative purposes)
Red line: T2108 Overbought (70%); Blue line: T2108 Oversold (20%)
Weekly T2108

*All charts created using freestockcharts.com unless otherwise stated
The charts above are the my LATEST updates independent of the date of this given T2108 post. For my latest T2108 post click here.
Related links:
The T2108 Resource Page
Expanded daily chart of T2108 versus the S&P 500
Expanded weekly chart of T2108
Be careful out there!
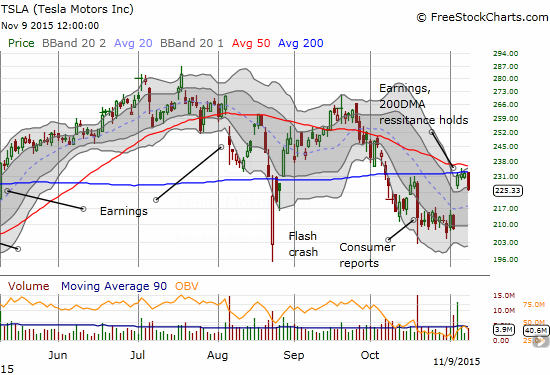
Full disclosure: long TSLA put options, long EEM put aand call options