
(T2108 measures the percentage of stocks trading above their respective 40-day moving averages [DMAs]. It helps to identify extremes in market sentiment that are likely to reverse. To learn more about it, see my T2108 Resource Page. You can follow real-time T2108 commentary on twitter using the #T2108 hashtag. T2108-related trades and other trades are occasionally posted on twitter using the #120trade hashtag. T2107 measures the percentage of stocks trading above their respective 200DMAs)
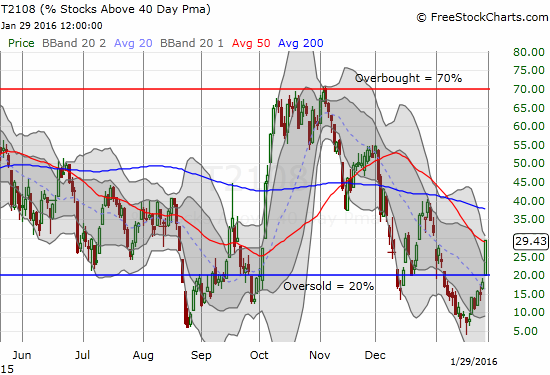
T2108 Status: 29.4%
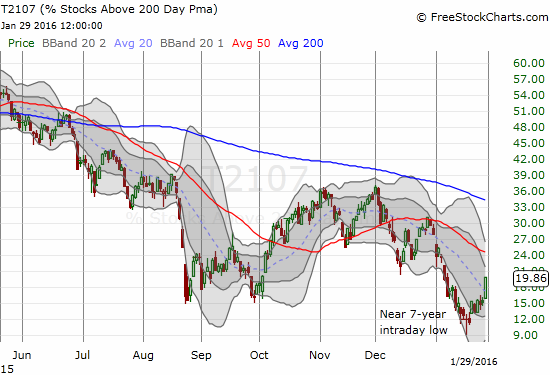
T2107 Status: 19.9%
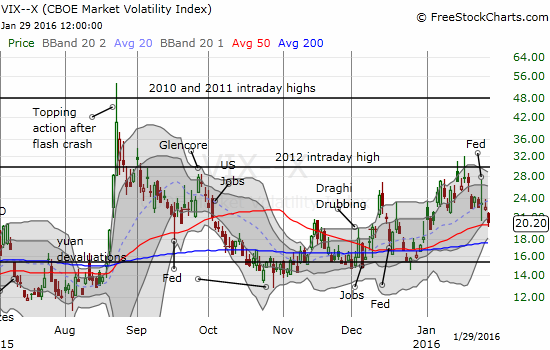
VIX Status: 20.2
General (Short-term) Trading Call: bullish
Active T2108 periods: Day #1 over 20% (ends 15 days oversold) (overperiod), Day #19 under 30%, Day #35 under 40%, Day #39 below 50%, Day #54 under 60%, Day #395 under 70%
Commentary
“Full Bull” was the theme for the last T2108 Update. Today’s theme should be “Fully Bullish” – at least to describe the way the stock market launched out of another historic oversold period.
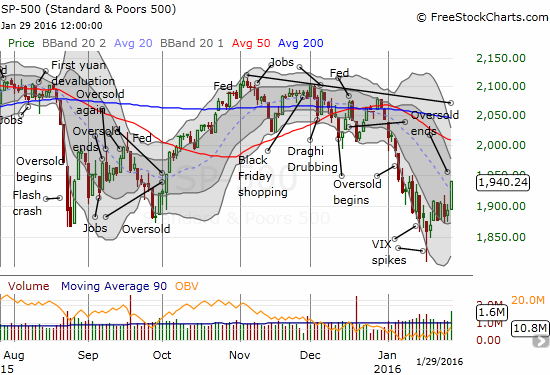
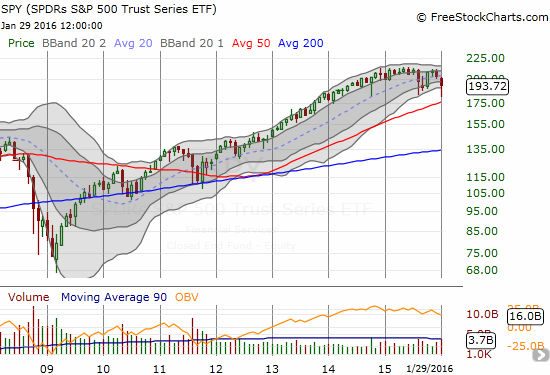
The S&P 500’s 2.5% gain was enough to punch the index right through the downtrend from its 20-day moving average (DMA). Overhead resistance looms next at the declining 50DMA which is coincidentally converging with 2000. That level provides the optimistic upside target for this breakout.
Unlike the deteriorating technicals that brought the market to this point, T2108, the percentage of stocks trading above their respective 40DMAs, fully confirmed the S&P 500’s breakout. T2108 gapped OVER the oversold threshold and never looked back. The close at 29.4% incredibly wiped out ALL of the losses for 2016.
T2107, the percentage of stocks trading above their respective 200DMAs, also came to life but it did not make as dramatic a breakout as T2108.
The volatility index, the VIX, also cooperated with the definitive change in tone. The post-Fed fade I anticipated has come two days late.
There are three key observations for the way this latest oversold period unfolded.
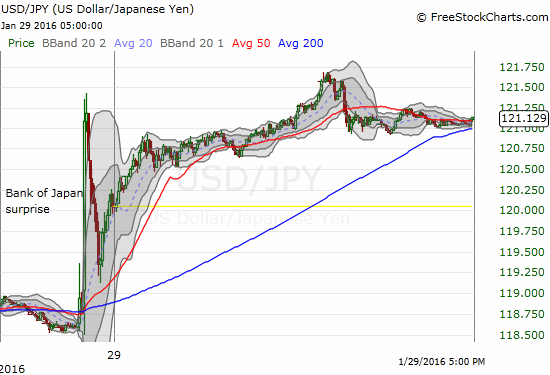
First, the bottom formed after the VIX spiked twice. I now define a spike anytime a stock or index trades “well above” its upper-Bollinger Band (BB). That band defnes a two standard deviation move away from the 20DMA. So a move even higher is truly extreme. The above chart of the S&P 500 shows where those spikes occurred. Note the second attempted bottom was confirmed when buyers first took the index well off its lows and followed up their commitment with more buying power the next two days.
An important sidebar: the monthly chart below for SPY is a stark reminder of the index’s stalled momentum. This is a slow-motion topping pattern if there ever was one. Note carefully the subtle lower highs and lower lows (on an intraday basis).
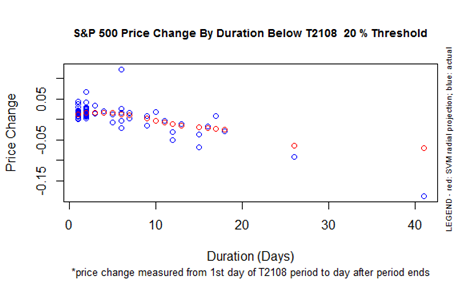
Second, the S&P 500 ended the oversold period almost exactly where it started: 1940.24 vs 1943.09 respectively. This performance is slightly better than expectations given historical patterns. Generally, the longer the oversold duration, the worse the performance of the S&P 500 after the oversold period finally ends. This last oversold period lasted 15 days.
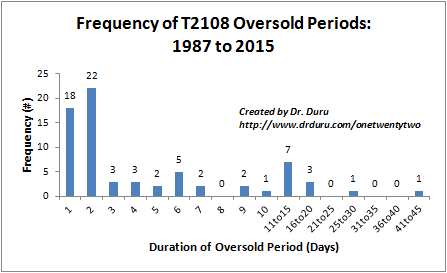
Third, this oversold period was historic. Only five oversold periods since 1987 have lasted longer. Moreover, the market has suffered five oversold periods in five months. These frequent returns to such depths of selling have the look and smell of bear market trading action. As I noted in an earlier T2108 Update, I expected the last oversold period to last around 25 days given the amount of time T2108 spent in single digits. Since the period ended well short at 15 days, I am bracing for yet another oversold period to arrive in coming weeks. I do not have a specific timetable.
Given these observations, my go-forward strategy is a mix of intention and pragmatism. My intention is to hold my remaining bullish trades from the oversold period until the S&P 500 hits natural overhead resistance from the downtrending 50DMA. Being pragmatic, I will be looking for fresh hedges in the coming week. My interest in such hedges will become more aggressive as the targeted stock or index approaches natural resistance levels.
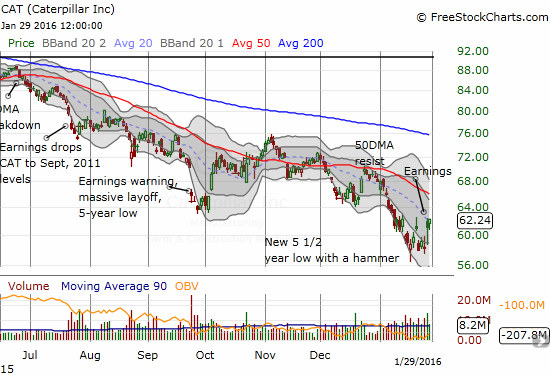
As readers know, Caterpillar (CAT) is one of my favorite hedges against bullishness. As the chart below shows, CAT may actually be in the middle of a bottoming formation. So, I will start tentatively in order to hold a “just in case” position.
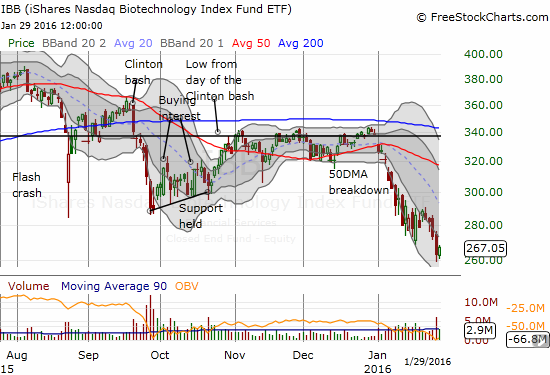
In previous weeks, I threw up a yellow and then a red flag on iShares Nasdaq Biotechnology (IBB). In the previous week, IBB experienced a fresh breakdown that confirms bearish trading action. Yet another Congressional hearing on drug pricing is coming up on February 4th. I strongly suspect traders were selling early to get out the way. IBB should stay weak until the hearing ends. I will be watching closely to see how IBB reacts afterward. I may even (ugh) buy puts on IBB ahead of the hearing as early hedge…
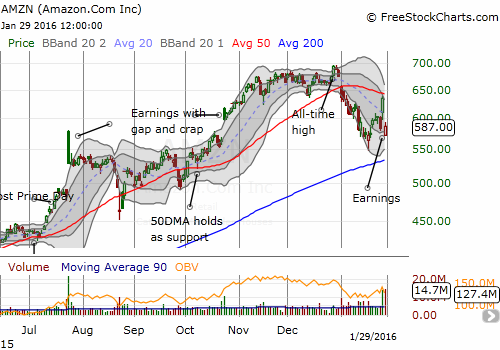
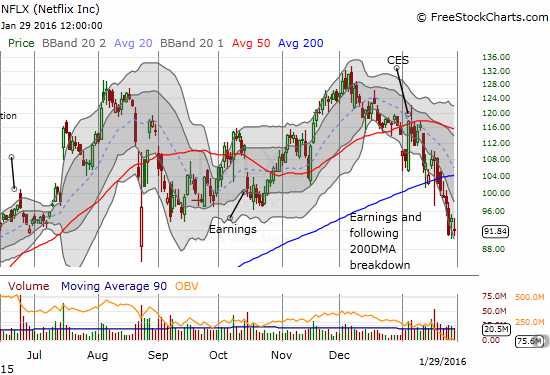
Netflix (NFLX) and Amazon.com (AMZN) also under-performed this week. AMZN’s post-earnings plunge was exaggerated by a strange 9% surge ahead of earnings. While that move was unreal, resistance at the 50DMA looks very real. Traders will no doubt ask whether the stumbles of these two titans of the market’s performance are providing early confirmation of topping in the general market.
On the positive side, Wal-Mart (WMT) continues to shine; value investors must be trying to squeeze into the barn door all at the same time. I sold my second swing trade (call options) into Friday’s close. WMT is now not only stretching above its upper-BB but also overhead resistance looms from the 200DMA. I am STILL waiting for some definitive news to explain this sudden interest in WMT. In the meantime, I am going to keep buying dips for swing trades. The last dip was a trader’s dream with a perfect test of 50DMA and immediate bounce.

Heading for solid exit from oversold conditions. %stocks>40DMA is about 28% heading into close. Thank you Bank of Japan! $SPY #T2108
— Dr. Duru (@DrDuru) January 29, 2016
Now that I have laid out the technical backdrop for the stock market, I am going into the presumed trigger for Friday’s celebration. The Bank of Japan went negative on monetary policy and sent the Japanese yen (FXY) plunging. Initially, stubborn yen buyers succeeded in pulling off a full reversal of the initial move, but they could not stop the bumrush.
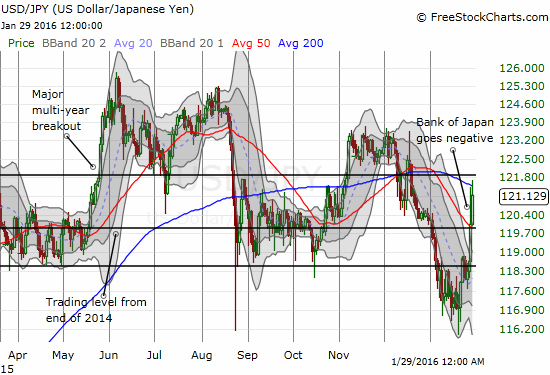
The BoJ clearly got increasingly concerned with the market’s return to the yen for “safety” during recent market turbulence:
“Recently, however, global financial markets have been volatile against the backdrop of the further decline in crude oil prices and uncertainty such as over future developments in emerging and commodity-exporting economies, particularly the Chinese economy. For these reasons, there is an increasing risk that an improvement in the business confidence of Japanese firms and conversion of the deflationary mindset might be delayed and that the underlying trend in inflation might be negatively affected.”
These are codewords for saying the Japanese yen is too strong.
With the BoJ taking action, the U.S. Federal Reserve is even more isolated on the island of policy divergence.
Now that the Bank of Japan has gone negative, no way the Fed can raise rates again anytime soon. $USDJPY $FXY $GBPJPY #forex
— Dr. Duru (@DrDuru) January 29, 2016
The BoJ has added its own loud confirmation that this is indeed a low-rate world. The Fed’s ceiling for normalization just got lower. The market recognizes this and has now pushed out the next rate hike all the way to December…and just barely.

Source: CME Group FedWatch
So, the market’s latest rally is at least partly a recognition that yet more liquidity is coming to the rescue. The BoJ has gone negative, and last week the European Central Bank (ECB) insisted that it is ready to do a lot more to pump liquidity into the eurozone economy. How long this relief lasts is anyone’s guess. I laid out the technical case for a short-lived respite.
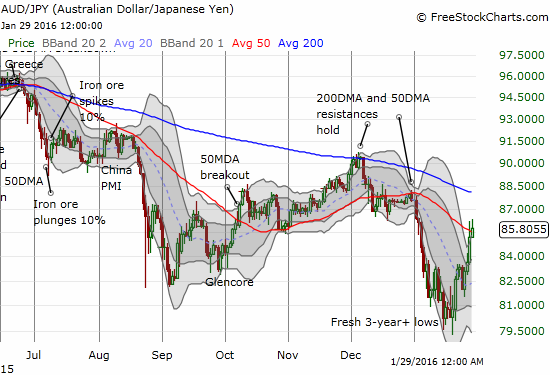
For now, market sentiment is in a healing mode. The Australian dollar (FXA) versus the Japanese yen is working on a breakout above 50DMA resistance thanks to the Bank of Japan’s generoisty. Such a breakout would confirm the improvement in sentiment.
— – —
For readers interested in reviewing my trading rules for T2108, please see my post in the wake of the August Angst, “How To Profit From An EPIC Oversold Period“, and/or review my T2108 Resource Page.
Reference Charts (click for view of last 6 months from Stockcharts.com):
S&P 500 or SPY
U.S. Dollar Index (U.S. dollar)
EEM (iShares MSCI Emerging Markets)
VIX (volatility index)
VXX (iPath S&P 500 VIX Short-Term Futures ETN)
EWG (iShares MSCI Germany Index Fund)
CAT (Caterpillar).
IBB (iShares Nasdaq Biotechnology).
Daily T2108 vs the S&P 500
")
Black line: T2108 (measured on the right); Green line: S&P 500 (for comparative purposes)
Red line: T2108 Overbought (70%); Blue line: T2108 Oversold (20%)
Weekly T2108

*All charts created using freestockcharts.com unless otherwise stated
The charts above are the my LATEST updates independent of the date of this given T2108 post. For my latest T2108 post click here.
Related links:
The T2108 Resource Page
Expanded daily chart of T2108 versus the S&P 500
Expanded weekly chart of T2108
Be careful out there!
Full disclosure: long SSO call options, long SSO shares, short AUD/JPY, long SVXY shares, short UVXY put.
Your thinking that the oversold period didn’t last long enough dovetails with my thinking that we will probably get a retest of the prior lows. I admit it’s not very scientific (is the market??), but is very consistent with past events like this.
Are we in a bear market? Looking at the charts of most stocks and also at T2107, it’s certainly close enough. The ‘formal’ definition almost doesn’t matter.
But for long term investors, another good selloff could be a great opportunity to pick up shares of good companies at reasonable, if not cheap, prices.
With a long term horizon in mind, bear markets are good times to get in. Having said that, it’s sure hard to do psychologically when the market is crashing and the VIX is rocketing up. But I’m getting better at it.
You’re thinking correctly: buy low and cheap. Sounds basic and easy, but hard to do! Stocks are cheap exactly when things look bleak. Not just a retest of the lows, but a break of the lows would certainly sweep a bunch more weak hands out the market. THAT could be the final washout to clear the way for a more sustained rally. As always, I take this one step at a time though…