
(T2108 measures the percentage of stocks trading above their respective 40-day moving averages [DMAs]. It helps to identify extremes in market sentiment that are likely to reverse. To learn more about it, see my T2108 Resource Page. You can follow real-time T2108 commentary on twitter using the #T2108 hashtag. T2108-related trades and other trades are occasionally posted on twitter using the #120trade hashtag. T2107 measures the percentage of stocks trading above their respective 200DMAs)
T2108 Status: 15.8%
T2107 Status: 15.7%
VIX Status: 22.5
General (Short-term) Trading Call: bullish
Active T2108 periods: Day #13 under 20%, Day #16 under 30%, Day #32 under 40%, Day #36 below 50%, Day #51 under 60%, Day #392 under 70%
Commentary
Will the U.S. Federal Reserve deploy its typical forces of anti-volatility? Or will the Fed put on some blinders to the ugliness in financial markets and charge forward with talk of rate hikes and policy normalization?
In the first case, the Fed acknowledges and defers to the market’s on-going push-out for the next rate hike. The odds are now borderline for a July rate hike at 51.5%. I added September given it is now the first month with significant odds for the next rate hike.
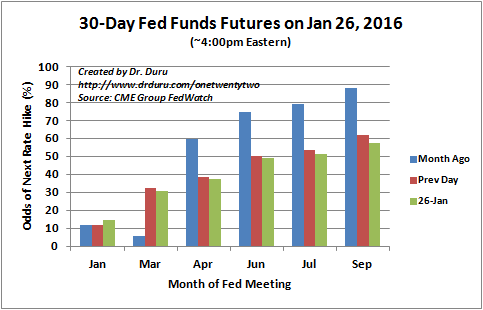
Source: CME Group FedWatch
If the Fed hints it is fine with the current set of market expectations, I fully expect a major sigh of relief that could create a rally strong enough to put a quick end to the current oversold period. T2108, the percentage of stocks trading above their respective 40-day moving averages (DMAs) closed the day at 15.8% – just under 5 percentage points away from the 20% oversold threshold.
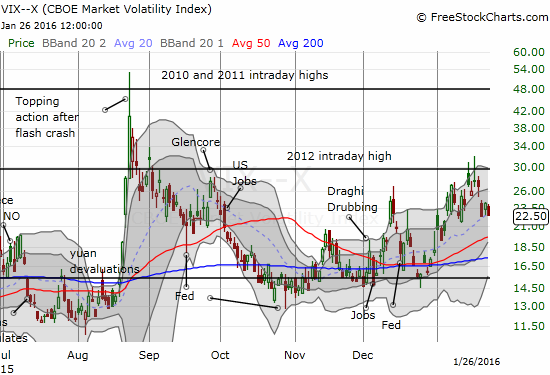
A Fed-inspired sigh of relief should at least grease the skids for a volatility index that is finally cooling off a bit. The VIX is still holding onto support at its uptrending 20DMA, but it looks ready to take the next step lower given Tuesday’s (January 26, 2016) decline.
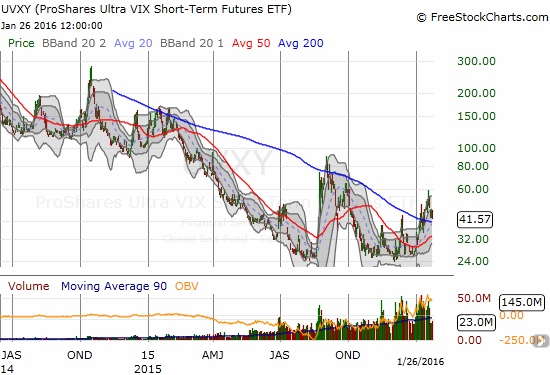
I positioned for Fed relief by purchasing a fresh tranche of put options on ProShares Ultra VIX Short-Term Futures (UVXY) expiring this Friday. This position is pitted against a second round of shorting a Feb put option as a hedge on future volatility. The chart below compares the current period to the same period a year ago. Note how August, 2014 led to an extended period of an elevated UVXY. It did not resume its “natural” downtrend until late February, 2015. The large surge in trading volume is partly a result of the lower share price and partly a result of the heightened fear in the market.
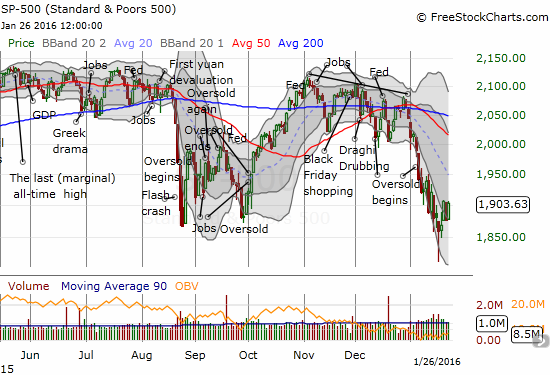
The second Fed case features guidance to tease the market toward expecting earlier rate hikes. Such a move should cause fresh hand wringing about the potential willingness of the Fed to get “hawkish” just as the global economy is falling apart. In this scenario, the market should experience sudden regression: volatility should spike, T2108 should descend all over again, and the S&P 500 (SPY) would lose the little momentum it has obtained since last week’s bottoming action.
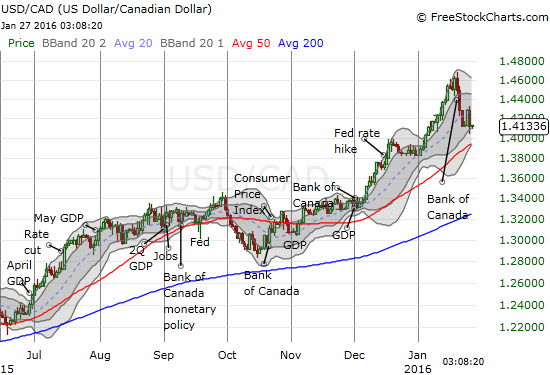
On the currency front, I have cleared space in my positions to buy any dip in the U.S. dollar index (DXY0). Last week, I discussed the Canadian dollar (FXC) in “The Canadian Dollar’s Rapid Devaluation: A Precarious Predicament for the Bank of Canada.” Since then, the Canadian dollar’s post-Bank of Canada strength continued as expected. On Tuesday, USD/CAD got “close enough” to the 1.40 target for me to close out the position and take profits. I am VERY keen to get back on trend (long USD/CAD), and I will be a buyer on a dip toward or to 1.40. This level now happens to coincide with 50DMA uptrending support.
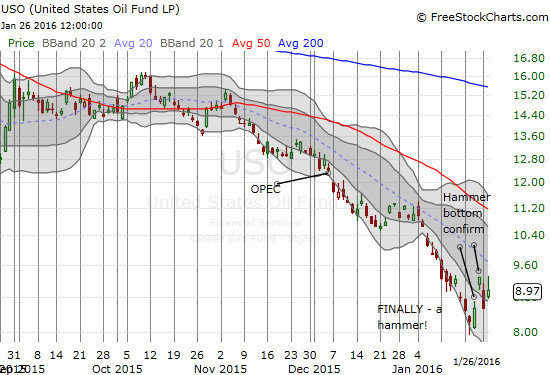
In my previous piece on the Canadian dollar I failed to acknowledge the likely contribution of the current surge in oil prices from recent lows. That rise continued on Tuesday and seems to confirm my claim that the United States Oil ETF (USO) has printed a bottom that should last longer than previous bottoms.
To summarize, I am thinking of the latest Fed trade as a binary trade. Either the Fed sticks to market expectations, or the Fed tries to convince market to price in an earlier rate hike. These options encompass the Fed’s simple calculus for hiking rates according to market expectations. If the Fed agrees with the market, the market will act agreeable. If the Fed starts a fight, the market will bite (before budging). I am expecting agreeable behavior but bracing for the bite. I do not expect the immediate reaction to be a lasting one. Very quickly, I think the market will return its attention to its on-going obsession with China, oil, and now earnings season.
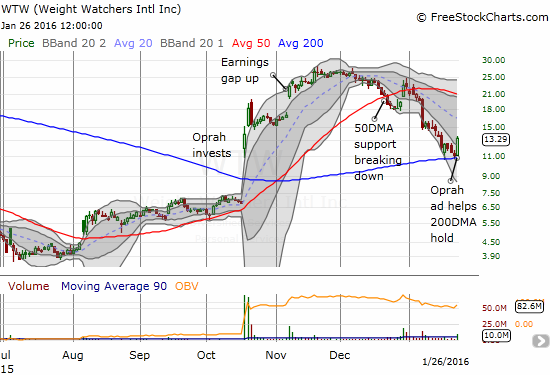
Here are three charts to whet the appetite, so to speak. The first two are particular potential for new swing trades that become even more interesting once T2108 exits this oversold period.
Eat bread. Lose weight. Whaaatttt? #ComeJoinMe https://t.co/jUgpk9ToXY
https://t.co/xtnB53EwSf
— Oprah Winfrey (@Oprah) January 26, 2016
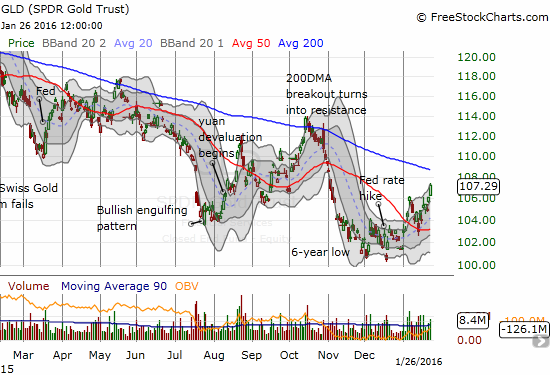
The push-out of rate expectations is likely helping to push gold off recent lows…
— – —
For readers interested in reviewing my trading rules for T2108, please see my post in the wake of the August Angst, “How To Profit From An EPIC Oversold Period“, and/or review my T2108 Resource Page.
Reference Charts (click for view of last 6 months from Stockcharts.com):
S&P 500 or SPY
U.S. Dollar Index (U.S. dollar)
EEM (iShares MSCI Emerging Markets)
VIX (volatility index)
VXX (iPath S&P 500 VIX Short-Term Futures ETN)
EWG (iShares MSCI Germany Index Fund)
CAT (Caterpillar).
IBB (iShares Nasdaq Biotechnology).
Daily T2108 vs the S&P 500
")
Black line: T2108 (measured on the right); Green line: S&P 500 (for comparative purposes)
Red line: T2108 Overbought (70%); Blue line: T2108 Oversold (20%)
Weekly T2108

*All charts created using freestockcharts.com unless otherwise stated
The charts above are the my LATEST updates independent of the date of this given T2108 post. For my latest T2108 post click here.
Related links:
The T2108 Resource Page
Expanded daily chart of T2108 versus the S&P 500
Expanded weekly chart of T2108
Be careful out there!
Full disclosure: long SVXY shares, long and short UVXY put options, long SSO call options, long SSO shares, short USO call and put options and long call options, long WTW call options, long FXC, long GLD