
(T2108 measures the percentage of stocks trading above their respective 40-day moving averages [DMAs]. It helps to identify extremes in market sentiment that are likely to reverse. To learn more about it, see my T2108 Resource Page. You can follow real-time T2108 commentary on twitter using the #T2108 hashtag. T2108-related trades and other trades are occasionally posted on twitter using the #120trade hashtag. T2107 measures the percentage of stocks trading above their respective 200DMAs)
T2108 Status: 9.5% (5-month closing low)
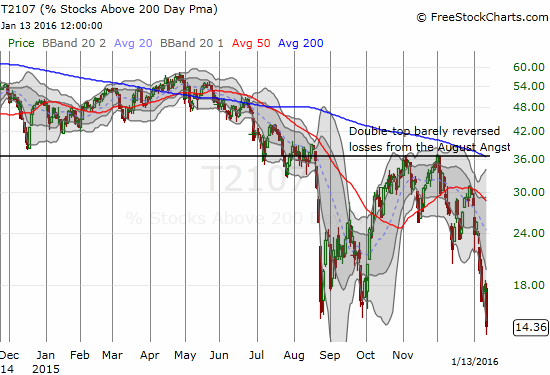
T2107 Status: 17.2% (4 1/2 year closing low)
VIX Status: 25.2% (still below last week’s high)
General (Short-term) Trading Call: bullish
Active T2108 periods: Day #5 under 20%, Day #8 under 30%, Day #24 under 40%, Day #28 below 50%, Day #43 under 60%, Day #384 under 70%
Reference Charts (click for view of last 6 months from Stockcharts.com):
S&P 500 or SPY
SDS (ProShares UltraShort S&P500)
U.S. Dollar Index (volatility index)
EEM (iShares MSCI Emerging Markets)
VIX (volatility index)
VXX (iPath S&P 500 VIX Short-Term Futures ETN)
EWG (iShares MSCI Germany Index Fund)
CAT (Caterpillar).
IBB (iShares Nasdaq Biotechnology).
Commentary
T2108, the percentage of stocks trading above their respective 40-day moving averages (DMAs), sank to rare single-digit territory. At 9.5%, this oversold period joins just 15 other oversold periods since 1987 that have sent T2108 into single digits. (Recall that I define oversold as T2108 trading below 20%). Since 1987, the market has experienced 70 oversold periods. The last oversold period that included a T2108 dive into single digits was just last August/September. T2108 has not experienced a 1-2 punch like this since the 2008/2009 financial crisis.
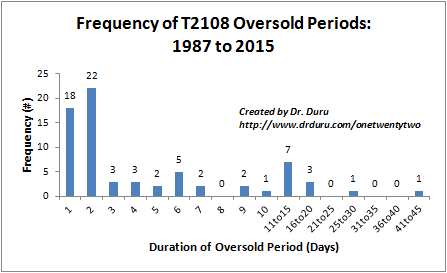
Another way to look at the rarity of T2108 trading action is to count trading days. Of the 7311 trading days since 1987, 5.1% have suffered oversold trading. Of those 372 oversold trading days, 26.1% have suffered T2108 below 10%. The crash of 1987 produced the longest oversold period on record (I have data since late 1986). Excluding 1987, these numbers shift a bit to 4.7% of trading days spent in oversold territory and 19.0% of those oversold trading days below 10%. In other words, very roughly, for every five days that an oversold period drags on, one of those days features T2108 dropping into single digits. This is day #5 of the oversold period and day #1 under 10% – right on track! Unless the market makes an amazing comeback tomorrow (January 14, 2016), this oversold period could very well last 9 or 10 days before it ends with one more day of single digits for T2108.
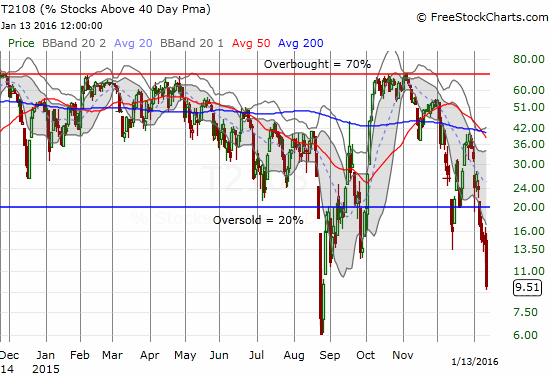
Twenty-two oversold periods have lasted longer than this 5-day one. I mention this because the frequency and ferocity of these oversold periods since August further confirms that this market is suffering a major deterioration in its technicals. I am now worrying that a VERY long, extended oversold period is imminent before a sustained bottom occurs. Based on the chart below, “long” may be defined as 11 to 20 days. Only two oversold periods have lasted longer (in 1987 and 2008 – major crisis years!).
T2107, the percentage of stocks trading below their 200DMAs, may be working in favor of an imminent end to this oversold period. T2107 has plunged all the way to 14.4%, a whopping 4 1/2 year closing low.
These extreme technicals translate into an S&P 500 (SPY) stretched further and further downward. For the fourth trading day of the last six, the index closed below its lower-Bollinger Band. Sellers remain firmly in control of this market but the “rubber band” is getting stretched awfully thin…
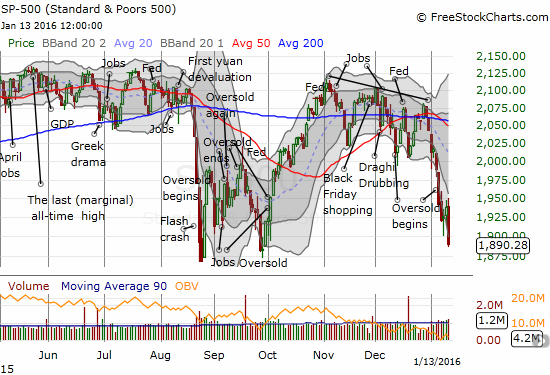
With sellers asserting themselves so forcefully, I would have expected the volatility index, the VIX, to trade a LOT higher than current levels. Instead, the VIX has still not overcome resistance from the 2012 intraday low and did not even close at a high for this oversold period.
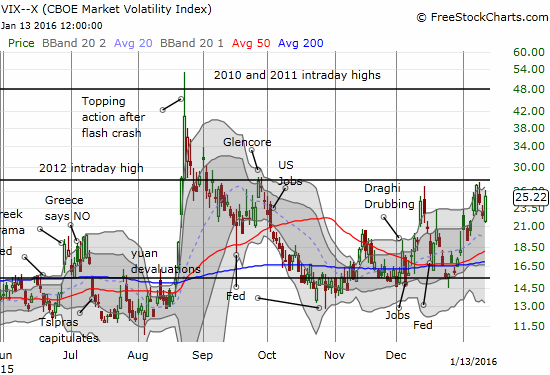
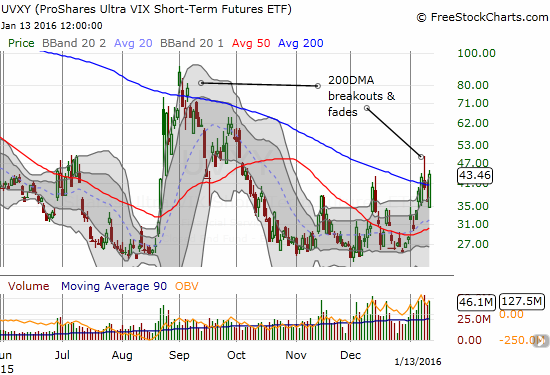
Like the volatility spike last Friday, I moved to fade the VIX. I technically prefer a spike to a new high as a sign that fear could finally be reaching a peak. Since the VIX was not yet above its upper-BB, I put in a lowball offer for more shares in ProShares Short VIX Short-Term Futures (SVXY). That order never filled. I did grab some fresh put options on ProShares Ultra VIX Short-Term Futures (UVXY) in case that order never filled. Unlike Friday, I did not get an intraday reversal to generate a quick and profitable trade.
I held off on adding more shares or call options on ProShares Ultra S&P500 (SSO). This trade is at the top of my list going forward.
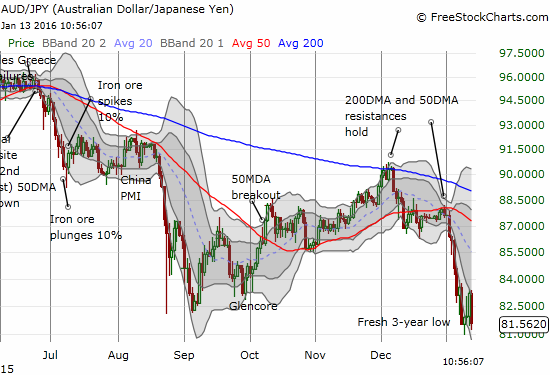
My favorite sentiment indicator from the currency market, AUD/JPY, the Australian dollar (FXA) versus the Japanese yen (FXY), also surprised me as it failed to break to a fresh low for the oversold period. This behavior provides some support for a tradeable bounce. At the time of writing, AUD/JPY is rallying strongly off lows and I am beginning a fresh fade as a hedge…
With T2108 in single-digits, I am compelled to finally get a lot more aggressive in making buys – even without a fresh spike in the VIX. As an old trading friend would say, this is a time to hold my nose and buy. It is folly to try to pick an exact bottom, but this is a moment where I am getting more comfortable assuming the market is “close enough” (even as I am increasingly uncomfortable that I have so few hedges left!). Even more conservative traders should not wait until T2108 exits the oversold period. Instead, a break below the day’s low on the VIX should provide a buy signal with a sufficient reduction of additional downside risk. Even long-term investors should plan to put some cash to work here: just like the last deep plunge into oversold territory, this is a classic “buy the dip” moment for those of you with equally deep faith in the future of the market.
I went after more individual stocks with a focus this time on shares as well as call options (expiring next week and February). I was particularly keen to load up on home builders which I think are being hit at a time when the housing market still appears good. Moreover, this is the best time of the year to trade housing-related stocks.
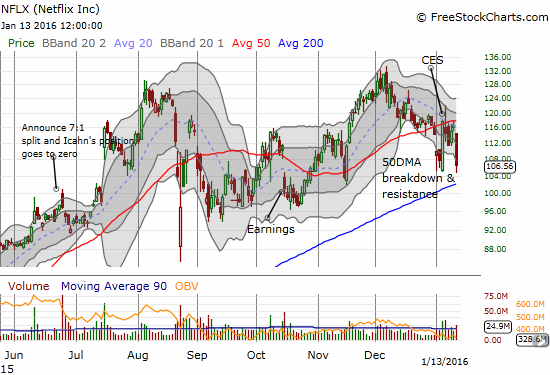
Even as I ramp up my accumulation mode, I recognize that the ugliness of the selling means that some timely short positions could rake in a lot of profit for the quick (and the fortunate). For example, Netflix (NFLX) plunged as much as 10% before closing with a 8.6% loss. This drop confirms the 50DMA as resistance after a classic short setup printed the previous day: the 50DMA held firm and NFLX closed with the declining 20DMA proving itself as firm resistance as well. If not for my rule to avoid new short positions during an oversold period, NFLX would have been a perfect stock to chase down right from the open.
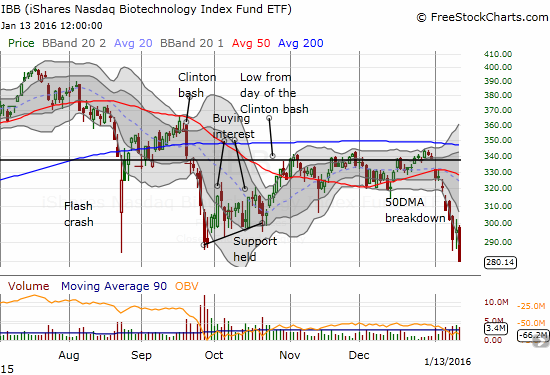
The iShares Nasdaq Biotechnology ETF (IBB) is now officially breaking down. I threw up the white flag on IBB last week. I now throw up the red flag. IBB should still be good for solid oversold bounces, but the ETF is exhibiting dangerous bear behavior. IBB closed at a level last seen around October, 2014. The current high-volume selling confirms the 50DMA breakdown that started 2016 for IBB. I would have to hold my nose a very LONG time to buy into IBB here for more than a quick bounce.
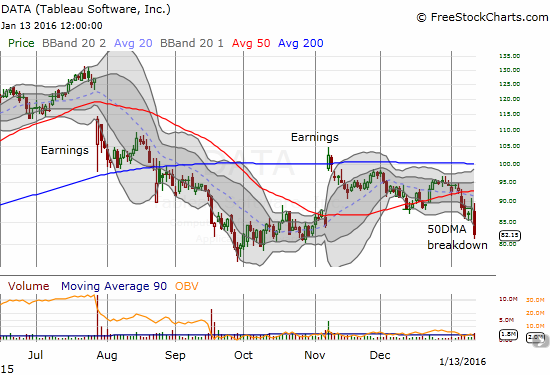
I have my eye on Tableau Software (DATA) for a buy. Today’s selling confirmed the complete reversal of DATA’s impressive post-earnings gap up from last October. I am interested in a retest of the pre-earnings lows.
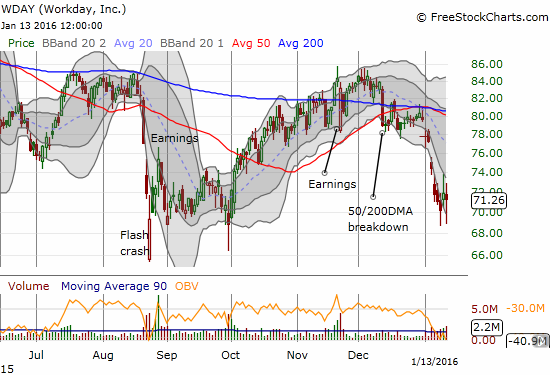
Workday (WDAY) is already over-stretched. Sellers closed out the stock for four straight days below the lower-BB before buyers finally fought back. I bought on today’s plunge below the lower-BB and was fortunate to find like-minded buyers. I think a stock like WDAY can easily bounce back to 50DMA resistance on an oversold bounce.
For readers interested in reviewing my trading rules for T2108, please see my post in the wake of the August Angst, “How To Profit From An EPIC Oversold Period“, and/or review my T2108 Resource Page.
Daily T2108 vs the S&P 500
")
Black line: T2108 (measured on the right); Green line: S&P 500 (for comparative purposes)
Red line: T2108 Overbought (70%); Blue line: T2108 Oversold (20%)
Weekly T2108

*All charts created using freestockcharts.com unless otherwise stated
The charts above are the my LATEST updates independent of the date of this given T2108 post. For my latest T2108 post click here.
Related links:
The T2108 Resource Page
Expanded daily chart of T2108 versus the S&P 500
Expanded weekly chart of T2108
Be careful out there!
Full disclosure: long SVXY shares, long UVXY put options, long SSO call options, long SSO shares, short AUD/JPY, long IBB call options, long WDAY call options
I was there buying with you today, with full knowledge that the market probably will fall further. Today’s bargains might look pricey next week; I’ve been there before….
My thinking now is that we are just getting into the ‘panic’. Many investors will panic and dump there mutual funds, which in turn will need to liquidate holdings. That will further depress the market. There won’t be enough bargain hunters for a while to counteract the selling. T2108 could stay well under 20%, and maybe even go to LOW single digits before we get a sustained bounce.
There’s no recession in sight, and the US economic data is still decent. That’s the good news.
Market sentiment is bad and getting worse. That’s also good, but it won’t turn the market around.
If earnings go well, that should help. But anybody who’s expecting the market to resume its uptrend is going to likely be waiting for quite a while.
Newer investors used to the long bull market and who have had little or no experience with severe bear market action may need to put on a diaper before they check their portfolios, at least for a while.
Great analysis as usual, Duru.
So this is a diaper-testing moment? 🙂
I have another update coming this weekend. Generally, I agree with you. However, earnings season makes it VERY tough to play individual stocks for the bounce. But it will be very easy to pick up individual stocks unfairly pounded post-earnings/guidance just because sentiment was so extreme in negativity. In the case of stocks like WYNN, waiting will miss a strong bounce, but could signify a lasting bounce.
Low single digits would take us to crisis levels. I will be there buying hand over fist under such conditions! I just hope we get monster spike in the VIX along with such plunge. That would finally wash out sellers.
Hi Dr. Duru,
what is you take on DATA now? im thinking of jumping in for a trade. whats your opinion? do you see it falling lower? I mean it has taken out support levels and is in no-mans land.
thanks. greg
It is truly ugly! My take is that the company is having a hard time selling such expensive licenses and now needs to slash prices and stuff their pipeline as much as they can. I am also assuming competitive pressures are finally weighing in on them. When a momentum stock crashes like this and loses favor, it is near impossible to come back to anything close to the darling it was. I am very intrigued on trading for the next bounce given it is very oversold and well below lower-Bollinger Bands. I think $51 or $52 is about as high as we can expect it to get for now.