
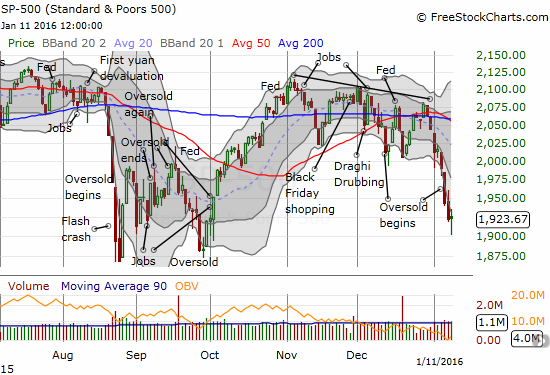
As almost every trader and investor knows, the new year of 2016 started off very poorly with a 6.0% drop for the S&P 500 (SPY). Nightly Business Report noted this is the worst start to a year…ever.
Source for prices: FreeStockCharts.com
We make a big deal out of the start of a new year because it is supposed to set the tone for what is hopefully good cheer and fresh hope. Understandably, this 5-day slugfest was very disappointing. However, there are plenty of 5-day losing streaks to examine from history. It turns out that 2016’s 5-day loss is the 66th worst since 1950. For example, just last summer, the S&P 500 (SPY) lost 10.9% in a 5-day stretch during the August Angst of 2015. That was the 10th worst 5-day losing streak. August 8, 2011 ended a 5-day loss of 13.0%, the 5th worst since 1950. In other words, the year has started in a painful way, but it is not quite as bad as it could be. Generally, we have been here before (I know – small consolation!).
I pulled together the chart below to show a rough timeline of these 5-day losses. I filtered out overlapping 5-day periods by choosing the maximum 5-day loss during the collection of days. Notice that when the selling is worse than it was to start 2016, it comes in clusters. So, if the current selling is any indicator, similar plunges could be coming this year and next year.
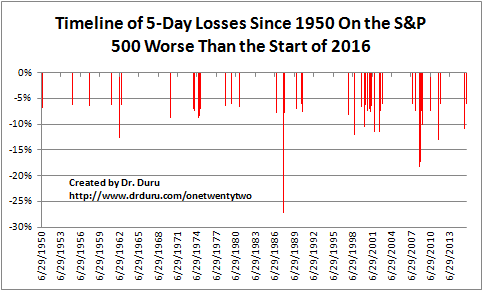
Source: Yahoo Finance
The heavy selling to start the year also brought oversold trading conditions. I measure oversold trading conditions using the percentage of stocks trading above their respective 40-day moving averages (DMAs), also known as T2108. I have data on T2108 going back to 1986. Since then, NO year’s first week of trading has included an oversold close.; 2016 is the first (see “Oversold and Dangerous Redux” to see my description of what happened when the stock market first closed in oversold conditions). The closest occurrences were in 1990 and 2008 which featured oversold trading later in the month of January. On the other side of New Year’s eve, four years had December’s with oversold trading conditions: 1987, 1994, 2007, and 2008. Both 1994 and 2007 were very marginal with 1-day oversold periods closing just under the 20% threshold.
So, 2016’s start is not only unusual in the depth of its selling, but also the context of the selling is quite notable. While the January barometer has undeniable shortcomings, I think the severity of this year’s start will impact and shape market sentiment well into the year.
Be careful out there!
Full disclosure: long SSO call options