
(T2108 measures the percentage of stocks trading above their respective 40-day moving averages [DMAs]. It helps to identify extremes in market sentiment that are likely to reverse. To learn more about it, see my T2108 Resource Page. You can follow real-time T2108 commentary on twitter using the #T2108 hashtag. T2108-related trades and other trades are occasionally posted on twitter using the #120trade hashtag. T2107 measures the percentage of stocks trading above their respective 200DMAs)
T2108 Status: 17.1%
T2107 Status: 19.5%
VIX Status: 25.0 (an elevated close last seen September, 2015)
General (Short-term) Trading Call: bullish with a “very short leash”
Active T2108 periods: Day #1 under 20% (first oversold daay ends 15 days over 20%), Day #4 under 30%, Day #20 under 40%, Day #24 below 50%, Day #39 under 60%, Day #380 under 70%
Reference Charts (click for view of last 6 months from Stockcharts.com):
S&P 500 or SPY
SDS (ProShares UltraShort S&P500)
U.S. Dollar Index (volatility index)
EEM (iShares MSCI Emerging Markets)
VIX (volatility index)
VXX (iPath S&P 500 VIX Short-Term Futures ETN)
EWG (iShares MSCI Germany Index Fund)
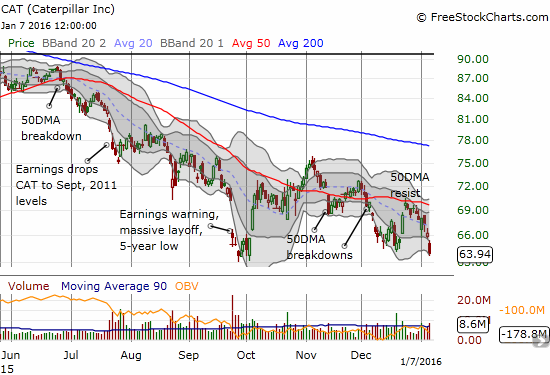
CAT (Caterpillar).
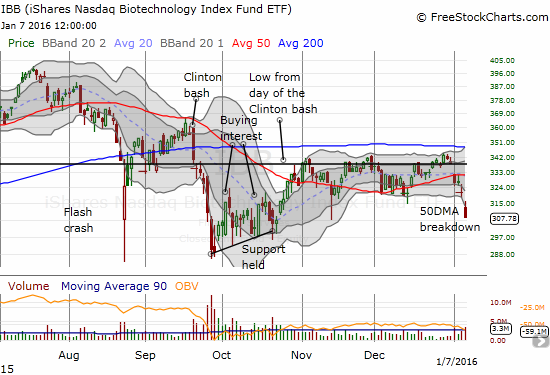
IBB (iShares Nasdaq Biotechnology).
Commentary
“Given the deteriorating technicals going into this oversold period – chronicled over and over again in previous days and weeks – I think trading conditions are actually even more dangerous than they were during the August Angst…
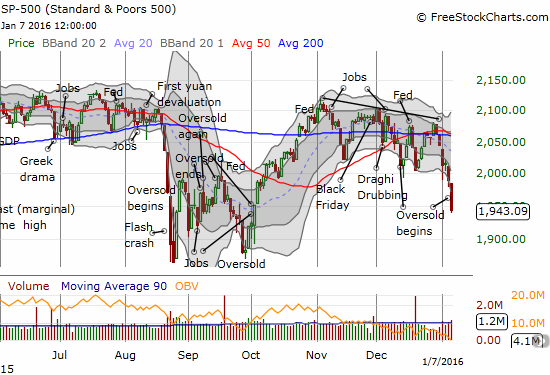
Astute traders will notice a particularly dangerous pattern that has developed in the S&P 500: a potential double-top. The double-top is messy but it is reinforced by the index’s stubborn insistence on trading just below the last all-time closing high set in May for three months until all heck broke loose in the August Angst. The rally off the subsequent W-bottom and oversold trading conditions decisively ended just short of the all-time high…twice, both times in November. So, the stock market is oversold but dangerous: sure it should bounce from round current levels, but the upside prospects are limited…
A retest of that W-bottom seems a near lock in the coming weeks or months. Again, because December is typically a mild month when it comes to maximum drawdowns, I am assuming a massive plunge is not in the cards for this month…”
This is what I wrote on December 11th as the last oversold period began. I titled the T2108 Update “Oversold But Dangerous” because the technical health of the market looked so poor going into the oversold period. I feel nearly the same going into this latest oversold period. T2108 closed at 17.1%. T2107, the percentage of stocks trading above their respective 200-day moving averages (DMAs) is starting this oversold period at 19.5%, even lower than the start of the last oversold period and a 3-month low. Most importantly, the S&P 500 (SPY) is also at a 3-month low.
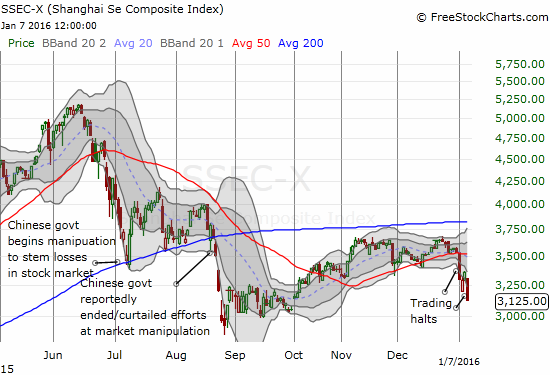
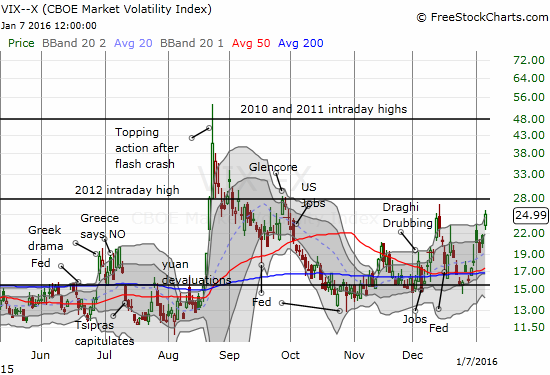
The volatility index, the VIX, closed at 25.0. The VIX has not closed this high since September 28th. The increasing fear is appropriate as the trading chaos in China adds a fresh element of trading uncertainty and instability in market sentiment.
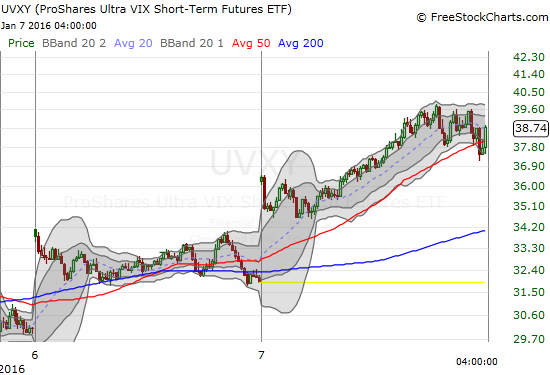
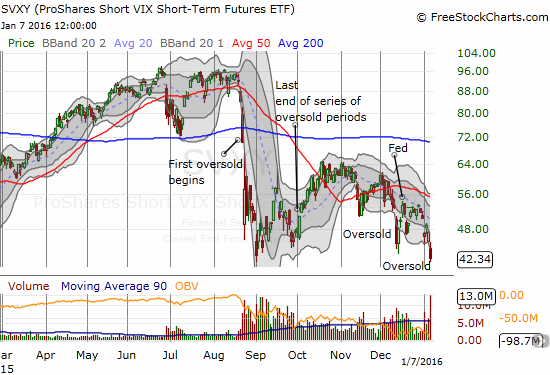
I went into this oversold period already holding a first tranche of one of my favorite trades on an oversold period: call options on ProShares Ultra S&P500 (SSO). Once T2108 dropped below 20%, I doubled down on those call options. Earlier in the day, I sold my call options on ProShares Ultra VIX Short-Term Futures (UVXY) as UVXY started fading from the open. It was up about 9% at that point. UVXY closed the day with a 22% gain (dang). After selling my UVXY call options, I bought shares in my other favorite play on oversold conditions: ProShares Short VIX Short-Term Futures (SVXY).
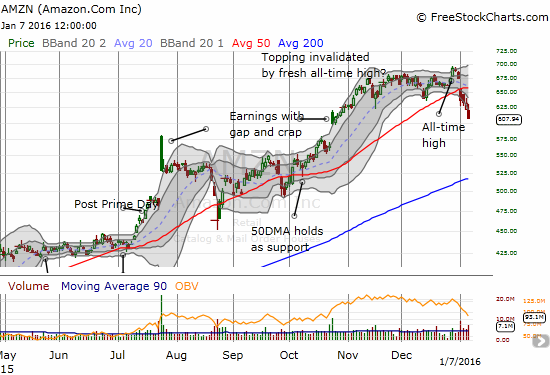
The stock market is full of broken down stocks now. I could spend the rest of the weekend posting the charts and barely scratch the surface. Even the leaders are getting hammered pretty good. For example, Amazon.com (AMZN) is breaking down sharply below its 50DMA. Even during the August Angst and subsequent sell-offs, AMZN spent a maximum of TWO days selling off below the 50DMA. It is starting to look like the last all-time high was a big fake-out. When it occurred, I thought it invalidated the topping pattern I pointed out in mid-December. AMZN has not closed lower since the company reported October earnings.
When the big leaders like AMZN look toppy, I think it is fair to call the stock market “dangerous.” As a reminder, this means I am shortening the duration of my trades on oversold conditions. I am also more willing to consider NEW short positions when T2108 is approaching, but NOT below, the 20% oversold threshold and the setup makes technical sense. Moreover, with China’s trading chaos, I held onto more bearish positions than my T2108 trading rules recommend.
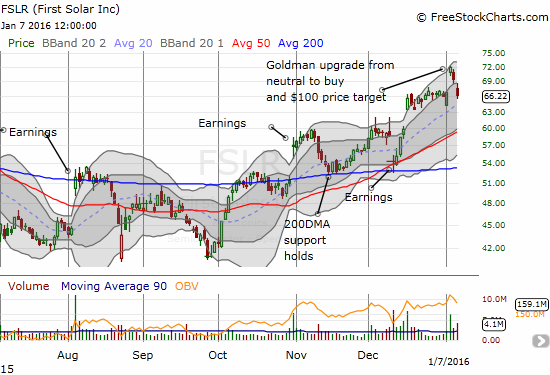
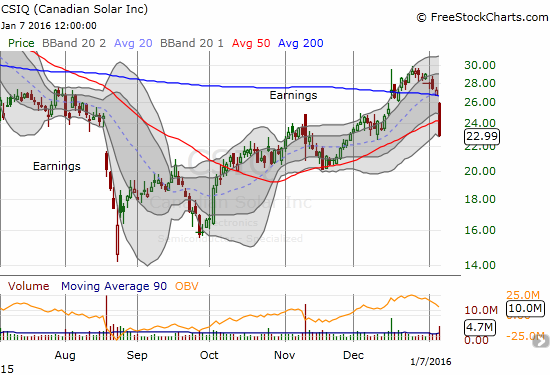
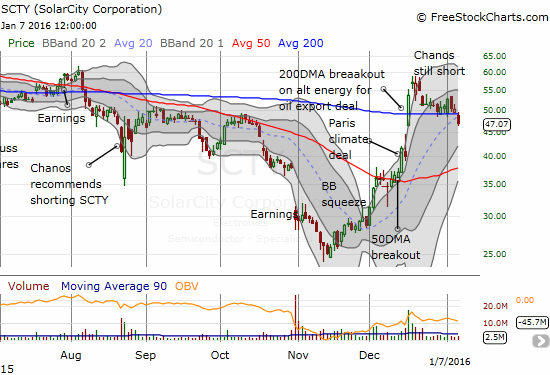
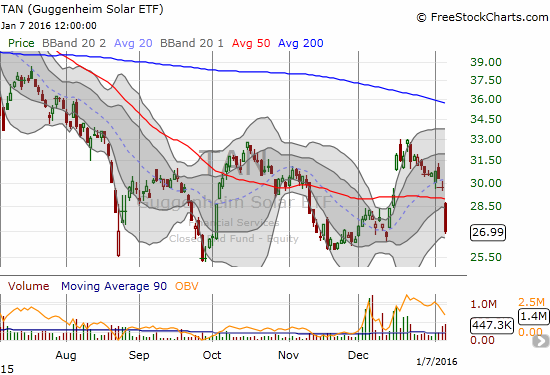
Solar was the darling this week for a hot minute. Goldman Sachs (GS) upgraded First Solar (FSLR) and sent the stock soaring. I patiently waited for the next entry point. It came in the form of a quick reversal of that gap up. I bought a single call option because too many technicals are now breaking down for solar stocks.
I am finally throwing up the white flag on iShares Nasdaq Biotechnology (IBB). IBB ALMOST fulfilled my prediction of a complete reversal of the “Clinton Bash.” Three times since last November, IBB closed above the low of that fateful day. The latest fall from that level features a very nasty, and I daresay, bearish 50DMA breakdown. I will be watching IBB closely to see whether it can emerge from oversold trading conditions in a healthier technical position.
And then there is Caterpillar (CAT). My favorite hedge on bullishness plunged back to a post-earnings low. Recall that my fistful of put options on CAT was my first bearish position to close on the selling that began the new year (dang).
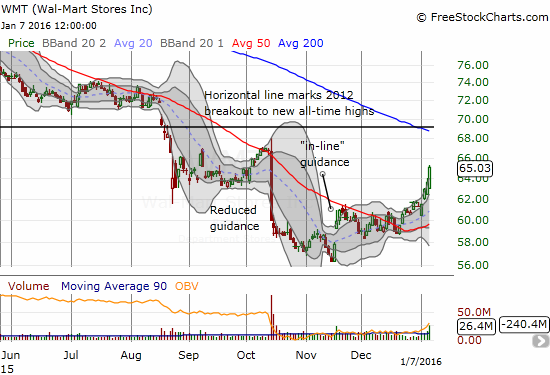
I will end on a good note. My play this week on Wal-Mart (WMT) is going amazingly well. I bought a long-term call option. However, with the stock up almost 10% from my entry point in just days, I find myself sitting on an 84% gain. If no new news comes out Friday to explain this strengthening, I will just lock in the profits and look for the next entry point.
Next up is the latest U.S. jobs report. =gulp=!
Daily T2108 vs the S&P 500
")
Black line: T2108 (measured on the right); Green line: S&P 500 (for comparative purposes)
Red line: T2108 Overbought (70%); Blue line: T2108 Oversold (20%)
Weekly T2108

*All charts created using freestockcharts.com unless otherwise stated
The charts above are the my LATEST updates independent of the date of this given T2108 post. For my latest T2108 post click here.
Related links:
The T2108 Resource Page
Expanded daily chart of T2108 versus the S&P 500
Expanded weekly chart of T2108
Be careful out there!
Full disclosure: long SVXY shares, long call options in SSO, FSLR, and WMT
From Bespoke:
“Yep, worst 5-day start to a year in the S&P 500’s history.”
“Right now, the S&P is more than 3.5 standard deviations below its 50-day.”
Everybody’s getting scared. Even you, Duru. The number of bears has soared.
I’m worried, too. And that means it’s about time to buy.
We may be getting close to a short term bottom, but chances are wherever that bottom is, there will be a retest later.
T2108 may even hit single digits again. This will frighten the hell out of everybody, including me. But I will be buying, realizing that a retest is likely, and that things could go lower. No guarantees of course, but it worked in 2011 and 2009…if you have the stomach for it, and a longer term horizon….
Great analysis as usual. I love reading it.
Yup! I am scared but not of complete collapse on the scale of 2009 or even 2011. I am firstly “scared” that the market has topped for a god while. So buying at a discount is a must. I will be there buying with you with T2108 in single digits – in fact, I have learned single digits is a time to REALLY load up. But where I differ is that I will likely sell my holdings well before you do.
Thanks for reminding me that the advice for long-term investors is a bit different. Most importantly, I am NOT telling anyone to panic and dump their investments. For long-term folks like yourself, T2108 gives guidance on particularly good opportunities to buy dips.
Thanks for reading!