
(T2108 measures the percentage of stocks trading above their respective 40-day moving averages [DMAs]. It helps to identify extremes in market sentiment that are likely to reverse. To learn more about it, see my T2108 Resource Page. You can follow real-time T2108 commentary on twitter using the #T2108 hashtag. T2108-related trades and other trades are occasionally posted on twitter using the #120trade hashtag. T2107 measures the percentage of stocks trading above their respective 200DMAs)
T2108 Status: 14.6% (as low as 13.1%)
T2107 Status: 17.2%
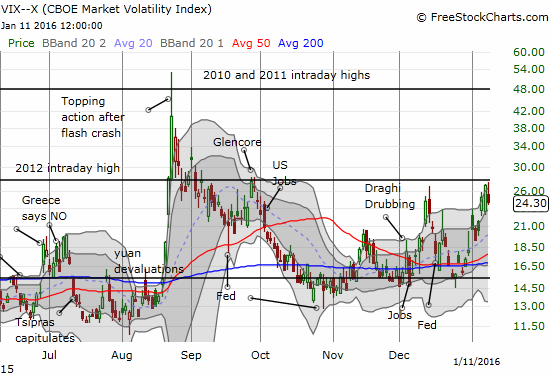
VIX Status: 24.3 (elevated but failed at resistance and faded from a high of 27.4)
General (Short-term) Trading Call: bullish with a “short leash”
Active T2108 periods: Day #3 under 20%, Day #6 under 30%, Day #22 under 40%, Day #26 below 50%, Day #41 under 60%, Day #382 under 70%
Reference Charts (click for view of last 6 months from Stockcharts.com):
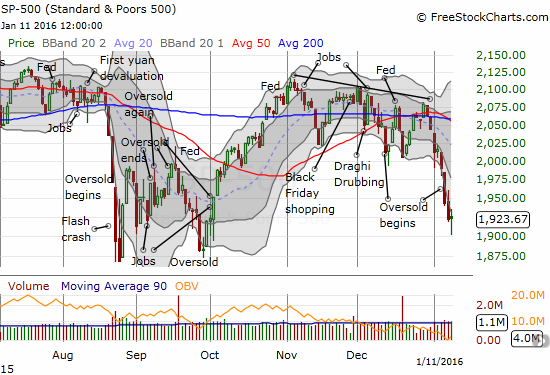
S&P 500 or SPY
SDS (ProShares UltraShort S&P500)
U.S. Dollar Index (volatility index)
EEM (iShares MSCI Emerging Markets)
VIX (volatility index)
VXX (iPath S&P 500 VIX Short-Term Futures ETN)
EWG (iShares MSCI Germany Index Fund)
CAT (Caterpillar).
IBB (iShares Nasdaq Biotechnology).
Commentary
Commodity names continue to collapse at an alarming pace, but a very subtle panic-driven bottom may have finally started (or occurred) for equity markets.
Cutting to the chase: the volatility index, the VIX barely surpassed Friday’s high when the volatility products went absolutely nuts. This contrast is important because it means buyers trying to bet on higher volatility rushed into the trade well ahead of what was actually happening in the market. The day ended with a substantial fade of the VIX and the associated long volatility products. With the VIX once again falling short of the 2012 intraday high, the trading action had all the appearances of a washout of fear. Like a panic-driven bottom for the market. It is subtle and a bit obscure without putting all the pieces together.
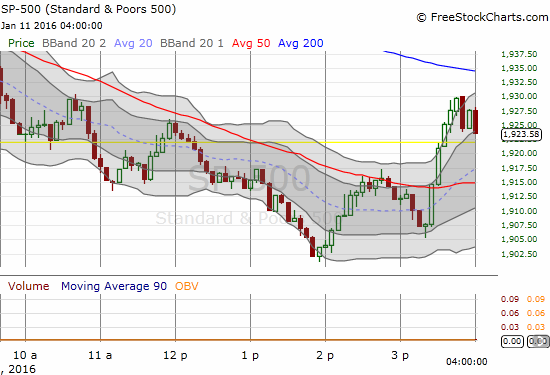
Here is a timeline…Around 1:50pm Eastern, the VIX peaked for the day at 27.4, a mere 1.4% gain over the previous day’s close. At the same time, iPath S&P 500 VIX ST Futures ETN (VXX) had soared to a 7.3% gain (I trigger alerts at 7%), and ProShares Ultra VIX Short-Term Futures (UVXY) reached a substantial 14.9%. Around this time, the S&P 500 (SPY) reached its low of the day at 1901.10, a 1.1% loss (notable but not panic-worthy). Finally, T2108, the percentage of stocks trading above their 40-day moving averages (DMAs) traded down to 13.1% just marginally below the intraday low from December, 2015.
Here are some charts to tell the story…
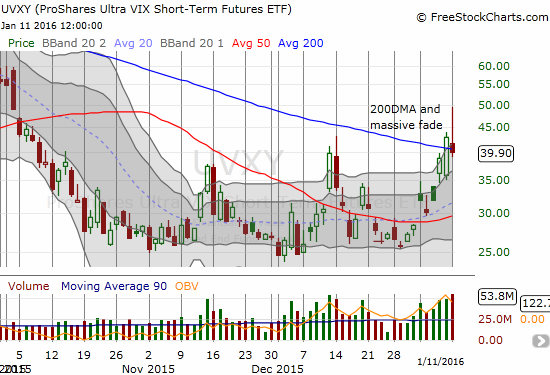
In the last T2108 Update I indicated I was finally ready to get more aggressive on the bullish side of trades. Ass soon as VXX hit 7%, I purchased more shares on SVXY and placed another order at a low-ball level. I added put options on UVXY. I had no idea of course at the time that these purchases would happen at THE turning point of the day, but the odds pointed that way with VXX and UVXY so stretched above their upper-Bollinger Bands (BBs). With the put options almost doubling by the close, I decided to lock in the profits. I am still sitting on the SVXY shares and previous UVXY put options. Per my T2108 trading strategy, I am holding SVXY until at least the end of the oversold period and likely further. For example, the Federal Reserve next announces monetary policy on January 27th – given current trends, this looks like a near-perfect setup for the fade volatility trade. I also made my first purchase of shares on ProShares Ultra S&P500 (SSO) which I will also hold in tandem with SVXY. I did not add to my SSO call options, but I will do so if the oversold period goes even deeper.
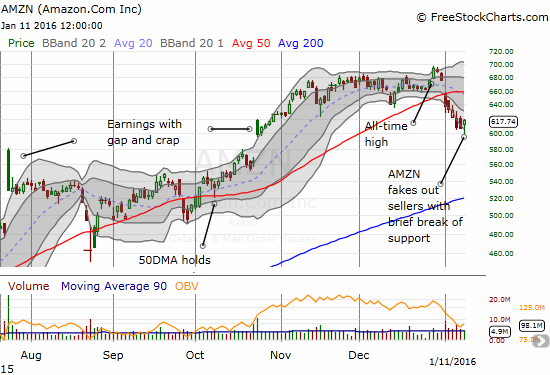
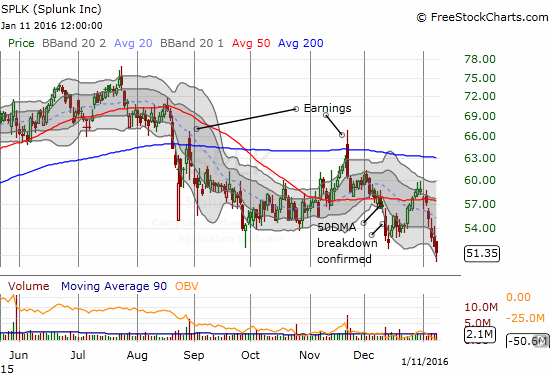
I also went to individual stocks and examined the usual suspects. I picked Amazon.com (AMZN) call options. AMZN fell to $600 before bouncing. I added more call options on iShares US Home Construction (ITB) (from a limit order set last week). I even decided to give Apple (AAPL) ONE more chance and snatched up a few more calls on the wilting stock. I did not have a chance to go after additional individual stocks although I did finally sell my put options on Splunk (SPLK). I am now even more committed to seeing this oversold period through.
Finally, from the last T2108 Update, I claimed that the Australian dollar (FXA) versus the Japanese yen (FXY), AUD/JPY, would signal the nature of trading for the open on the S&P 500. As noted above, the index did indeed open well. The index slipped in tandem with AUD/JPY and bounced with it. The key to the final depth of this oversold period may depend on (or correlate with) the ability of AUD/JPY to hold the current bottoming pattern (anther potential hammer).
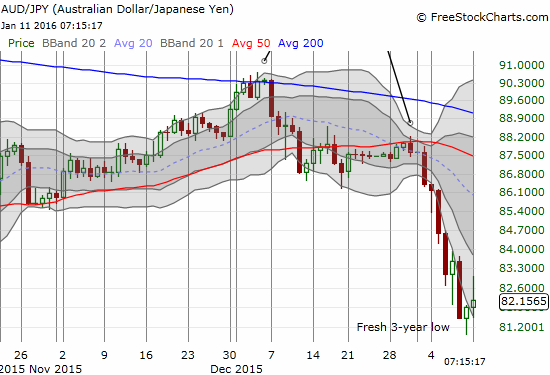
On the bounce, I refreshed a very small short position on AUD/JPY and will build the position back up (slowly) as AUD/JPY rises. I am still very bearish over the longer haul on the Australian dollar…
Daily T2108 vs the S&P 500
")
Black line: T2108 (measured on the right); Green line: S&P 500 (for comparative purposes)
Red line: T2108 Overbought (70%); Blue line: T2108 Oversold (20%)
Weekly T2108

*All charts created using freestockcharts.com unless otherwise stated
The charts above are the my LATEST updates independent of the date of this given T2108 post. For my latest T2108 post click here.
Related links:
The T2108 Resource Page
Expanded daily chart of T2108 versus the S&P 500
Expanded weekly chart of T2108
Be careful out there!
Full disclosure: long SVXY shares, long UVXY put options, long SSO call options, long SSO shares, long AMZN call options, short AUD/JPY