
(T2108 measures the percentage of stocks trading above their respective 40-day moving averages [DMAs]. It helps to identify extremes in market sentiment that are likely to reverse. To learn more about it, see my T2108 Resource Page. You can follow real-time T2108 commentary on twitter using the #T2108 hashtag. T2108-related trades and other trades are occasionally posted on twitter using the #120trade hashtag. T2107 measures the percentage of stocks trading above their respective 200DMAs)
T2108 Status: 32.4%
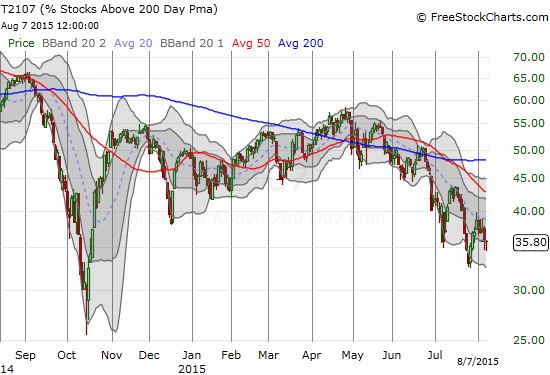
T2107 Status: 35.8%
VIX Status: 13.4
General (Short-term) Trading Call: Neutral
Active T2108 periods: Day #200 over 20%, Day #8 over 30% (overperiod), Day #15 under 40%, Day #55 under 50%, Day #72 under 60%, Day #271 under 70%
Reference Charts (click for view of last 6 months from Stockcharts.com):
S&P 500 or SPY
SDS (ProShares UltraShort S&P500)
U.S. Dollar Index (volatility index)
EEM (iShares MSCI Emerging Markets)
VIX (volatility index)
VXX (iPath S&P 500 VIX Short-Term Futures ETN)
EWG (iShares MSCI Germany Index Fund)
CAT (Caterpillar).
Commentary
The S&P 500 (SPY) has tested its 200DMA support for four cycles (depending on how you want to count) in just the last six weeks. Each test has produced the predictable outcome for a bull market that remains in an uptrend: a bounce off support.
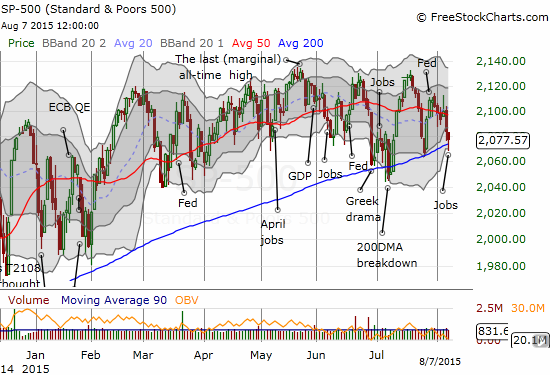
The latest test came as the market reacted to the July jobs number. The economic data seem like more of the same to me, so I cannot connect any dots from the data to the market. What I CAN say is that the U.S. dollar once again failed to break through its downtrend while the S&P 500 lost fractionally. I can also observe the 50DMA starting to turn downward. Moreover, the S&P 500 has failed to make a fresh all-time high from any of the bounces of support. Taken together, these behaviors imply a market in a weakening phase where buying power is subtly fading; the buyers are just barely able to rouse themselves enough for automatic purchases at support.
T2108 fell to 32.4% on the day. While T2108 is close again to “oversold enough” conditions to warrant some T2108 buys, I am not triggering. I now strongly prefer a true oversold reading to do any fresh (aggressive) T2108 trades. The market’s internals just look too shaky to me to warrant anything more optimistic.
T2107, the percentage of stocks trading above their 200-day moving averages, really screams out alarm at this point. T2108 has not traded over 50% since late June, and the indicator is still trapped in a definitive downtrend since 2015’s high in April.
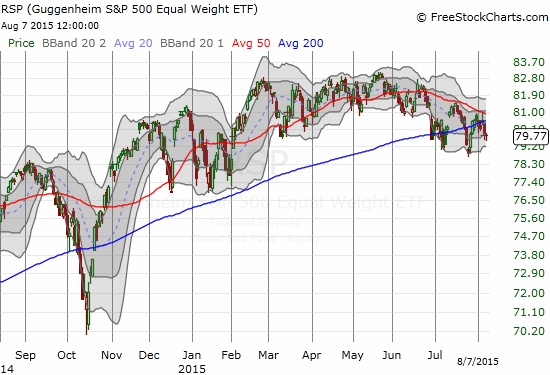
I still marvel that the S&P 500 can continue to perform so well even as such an important indicator demonstrates such consistent weakness. The Guggenheim S&P 500 Equal Weight ETF (RSP) is still showing hints of this weakness. RSP has trended down since May. So, the average stock is losing altitude even as the S&P 500 remains aloft.
So, it is natural to wonder…just how long can the S&P 500’s support continue to hold?
The volatility index (VIX) is still so low that buying insurance is a very attractive proposition. The VIX even DECLINED on Friday on a strong fade from its high at 14.58.
Homebuilders are one area of the market I still like a lot. I wrote about the extremely bullish earnings report from LGI Homes, Inc. (LGIH). Regional builder Century Communities Inc (CCS) also soared on a strong report (I will write about it soon). These stocks are leaders as overall homebuilders are just hanging in there.
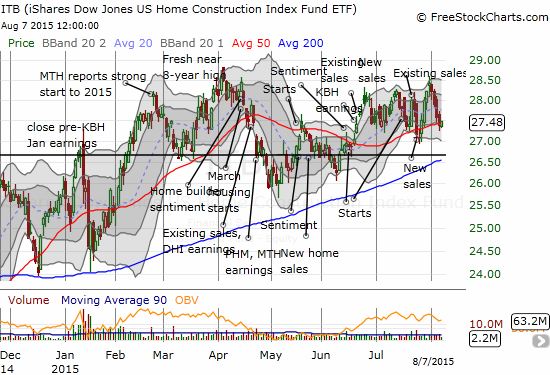
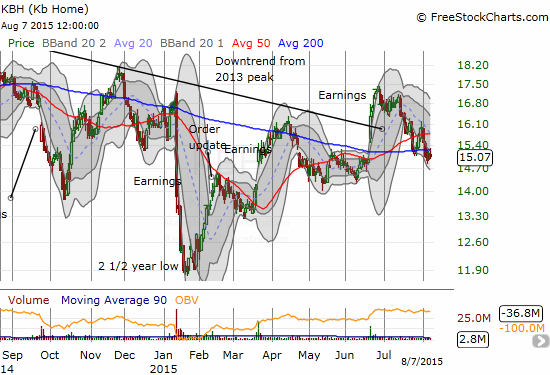
Of the major builders that have my interest, I am watching KB Home (KBH) particularly closely right now from a technical standpoint. KBH produced a strong earnings report in mid-June. After a few days of additional gains, the stock has been mainly downhill ever since. Last week, the stock officially and completely reversed its post-earnings gains. With closes below the 200DMA to boot, KBH is now in a dangerzone. In the chart below, note how this reversal means that KBH’s downtrend from its 2013 peak remains in play.
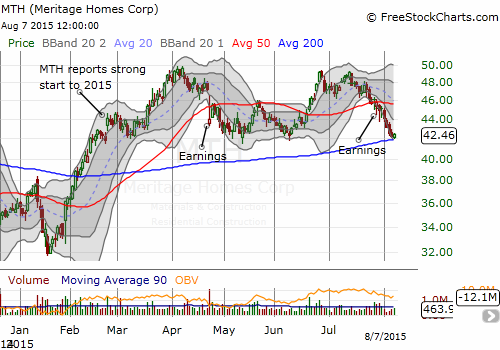
Meritage Homes (MTH) also has me worried. It closed Friday with a meek bounce off 200DMA support. Since a rip-roaring start to 2015, MTH has stalled out. The stock now trades directly below where it was when MTH proudly announced a very strong start to the year.
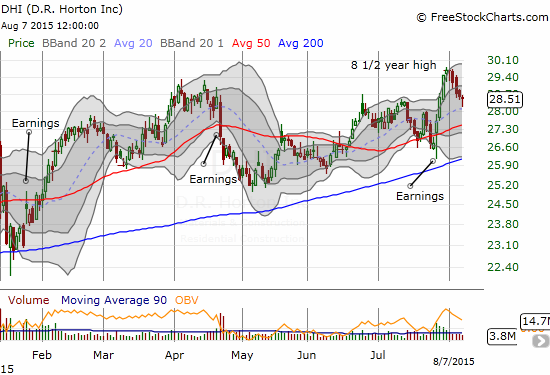
Back to the POSITIVE side, DR Horton Inc. (DHI) hit a fresh 8 1/2 year high at the end of July after a 4-day post-earnings sprint. The current pullback is generating a juicy buying opportunity for anyone not yet in the stock and even for swing traders. Note how DHI perfectly bounced off the 20DMA uptrend on Friday. Earnings seemed to validate the 200DMA as sustained support.
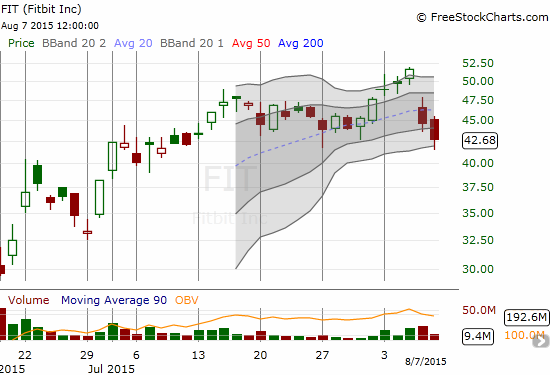
I conclude with a recent hot IPO: Fitbit (FIT). To me, FIT is the classic example of a fad stock that can ride the waves of euphoria much longer than one might expect. FIT upsized its IPO to 36.575 million shares and a $20/share debut. FIT opened at $30.40, got as high as $31.90, and closed at $29.68. I thought at best FIT would proceed to chop around with a weakening bias. Instead, FIT managed to run up about 72% going into its first earnings report as a publicly traded company. The market proceeded to knock the stock down despite strong headline numbers and increased guidance. The stock seems to be trading ahead of reality on the ground.
I am now watching like a hawk to see whether buyers return to give FIT a fresh breath of life and upward momentum; say, a close at a fresh post-earnings high. Otherwise, I can easily see FIT trading back toward its debut levels in coming months. Expectations are high with a 44 forward P/E (92 trailing P/E), 9x sales, and 34x book value. The last two days of post-earnings selling represent a 17% loss from FIT’s all-time high.
Daily T2108 vs the S&P 500
")
Black line: T2108 (measured on the right); Green line: S&P 500 (for comparative purposes)
Red line: T2108 Overbought (70%); Blue line: T2108 Oversold (20%)
Weekly T2108

*All charts created using freestockcharts.com unless otherwise stated
The charts above are the my LATEST updates independent of the date of this given T2108 post. For my latest T2108 post click here.
Related links:
The T2108 Resource Page
Expanded daily chart of T2108 versus the S&P 500
Expanded weekly chart of T2108
Be careful out there!
Full disclosure: long CCS, LGIH