
(T2108 measures the percentage of stocks trading above their respective 40-day moving averages [DMAs]. It helps to identify extremes in market sentiment that are likely to reverse. To learn more about it, see my T2108 Resource Page. You can follow real-time T2108 commentary on twitter using the #T2108 hashtag. T2108-related trades and other trades are occasionally posted on twitter using the #120trade hashtag. T2107 measures the percentage of stocks trading above their respective 200DMAs)
T2108 Status: 53.8%
T2107 Status: 51.3%
VIX Status: 14.0
General (Short-term) Trading Call: Staying bearish until new all-time high or oversold. Fading rallies
Active T2108 periods: Day #103 over 20%, Day #62 above 30%, Day #6 above 40%, Day #1 over 50% (overperiod)(ending 8 days under 50%), Day #9 under 60%, Day #173 under 70%
Reference Charts (click for view of last 6 months from Stockcharts.com):
S&P 500 or SPY
SDS (ProShares UltraShort S&P500)
U.S. Dollar Index (volatility index)
EEM (iShares MSCI Emerging Markets)
VIX (volatility index)
VXX (iPath S&P 500 VIX Short-Term Futures ETN)
EWG (iShares MSCI Germany Index Fund)
CAT (Caterpillar).
Commentary
In my last T2108 Update I wrote about a surprising calm that seemed to have settled over the market. I expected that calm to get upset post-Fed; a reversal of my usual expectations of the Fed acting as a soothing, anti-volatility force of nature. The irony is not lost on me that this time around, the typical post-Fed fade volatility plan would have worked almost better than ever today. The “plan” went awry as soon as the market slid a bit after the open (I was looking for more calm), and the S&P 500 just barely kissed 50DMA support. What unfolded next was a tremendous display of market relief as bears once again lost their grip on market sentiment. The rally sent the S&P 500 (SPY) higher 1.2%, the VIX plunged 11%, and T2108 soared from 45.4% to 53.8%.
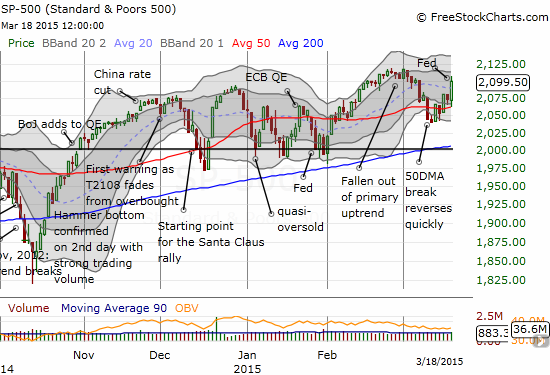
The rally was stoked by a master stroke of genius from the Federal Reserve that let it have its cake and eat it too. I sure did not even think about the possibility of the Fed pulling off rally-inspiring suggestions while at the same time threatening the market with a rate cut at anytime starting June. The key was a series of reduced forecasts for GDP, inflation, and the unemployment rate at which the economy starts to feel inflationary pressures. The Fed also adjusted its “dot plot” that pushed out rate hikes for the year. This Yahoo!Finance article – “Fed opens door wider for rate hike but downgrades economic outlook” – provides a pretty good summary.
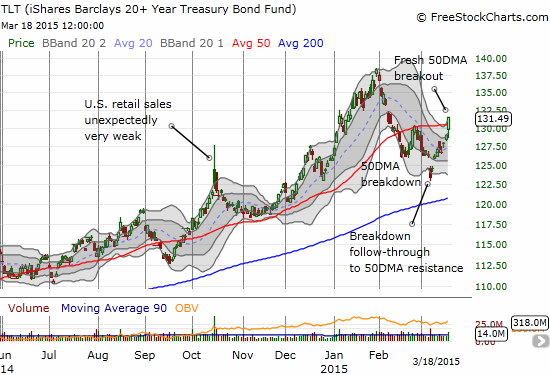
Even if it was inadvertent, the Fed’s performance was sheer genius. The forecasts allow the market to interpret dovish implications for policy, bullish ones for bonds, and bearish ones for the U.S. dollar. However, I do see a reality check: most of the rest of the developed world is currently turning the dial higher on monetary policy. Sweeden was the latest monetary zone to fall into negative rate policy. The PATH of U.S. monetary policy remains divergent from almost everyone else, so the U.S. dollar should eventually recover its former momentum. Even as the stock market seems poised to rally further on the good news that the economy is too weak to support imminent rate hikes, the U.S. dollar is likely to start rallying again. I am undecided on where bonds go next, but the technicals are bullish again. My position in iShares 20+ Year Treasury Bond (TLT) call options is actually almost flat now…much to my surprise!
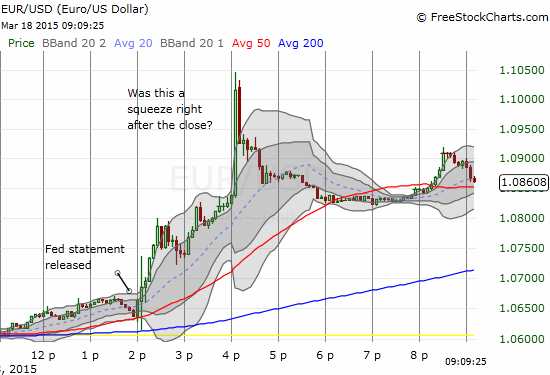
The action in the currency market was even more dramatic. The U.S. dollar weakened against all major currencies. There was an additional burst of weakness right after the close of trading in the U.S. that had all the markings of some kind of squeeze. Perhaps some big traders got hit by margin calls from over-extending themselves on dollar bullish bets. The quick reversal of that last surge makes me think it was a squeeze. These charts of the euro (FXE) versus the U.S. dollar show an example of what happened.
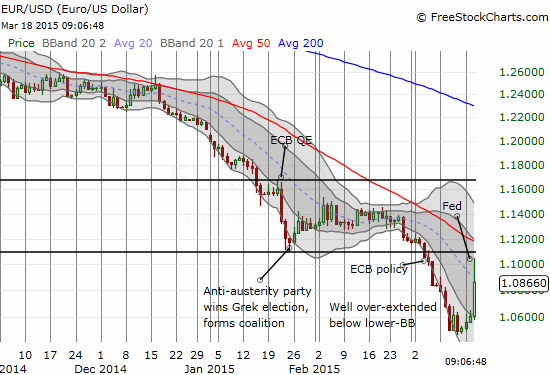
I used this rally as an opportune time to short the euro at much better prices and a much better technical position. As I have written earlier, I am OK being short the euro until it closes above the bottom of the previous channel (shown above). It is no surprise to me that a sudden squeeze/surge stopped short of that resistance level.
I also used the rally to restart into put options on Caterpillar (CAT). For now, I consider this position a bet that the selling will resume. It could develop into a hedge if the S&P 500 and T2108 manage to flip my overall market trading call to bullish.
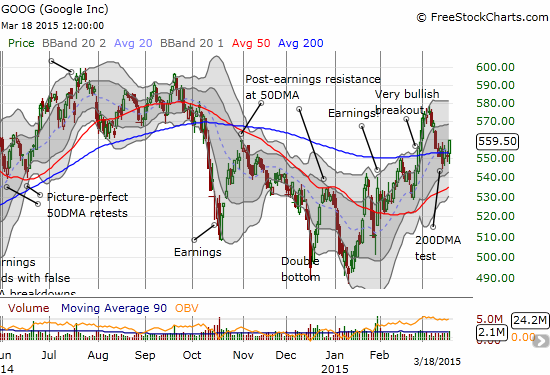
My biggest disappointment of a plan gone awry was watching iShares MSCI Emerging Markets (EEM) surge a whopping 2.5%. I left a LOT of profit on the table closing out that long side of my EEM hedged position. It would have paid for my put options with plenty of profit to spare. My biggest win was the rally in Google (GOOG) off its 200DMA. As I have explained before, the current technicals on GOOG make me OK trading the stock aggressively on the bullish side no matter what the general market is doing. So, I just happened to have a fistful of call options that paid off very well in today’s rally. I dared not try to stay greedy and hold another day. After all, the market often delivers fades of the Fed before moving on to its “true”, sustained reaction.
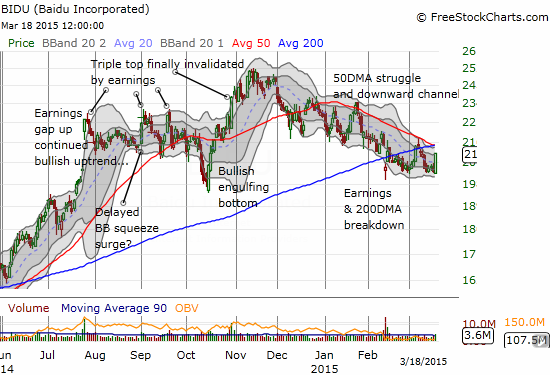
Fellow internet and search player Baidu (BIDU) also rallied today, but its technical position remains precarious. I really wanted to buy again, but I am forcing myself to wait until the stock proves itself with a breakout above overhead resistance from converged 50 and 200DMAs AND a downward trending trading channel.
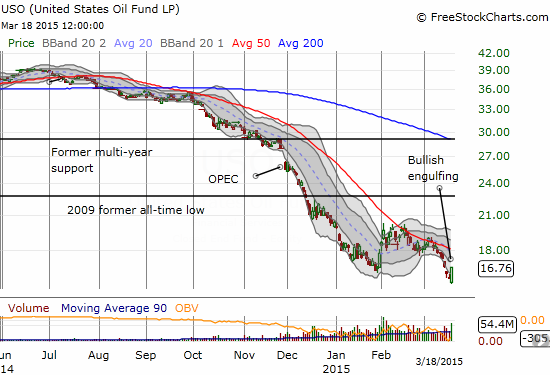
Finally, the weakness in the dollar helped out commodities. In particular, the United States Oil ETF (USO) experienced a nice jump off all-time lows. It now looks like it finally wants to print a sustainable bottom with a bullish engulfing surge. Please see “A Race Against Volatility And Bearish Sentiment For The United States Oil ETF” for my latest thoughts on trading USO.
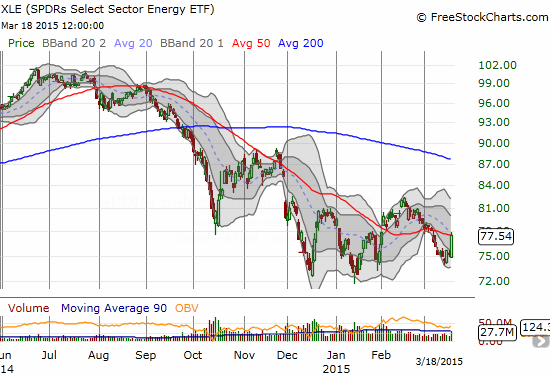
The Energy Select Sector SPDR ETF (XLE) also rallied, but it stopped cold at 50DMA resistance. Note that XLE has now made a third higher low. A likely bottom is very subtly unfolding. This development officially takes Direxion Daily Energy Bear 3X ETF (ERY) off my buying list for now.
Daily T2108 vs the S&P 500
")
Black line: T2108 (measured on the right); Green line: S&P 500 (for comparative purposes)
Red line: T2108 Overbought (70%); Blue line: T2108 Oversold (20%)
Weekly T2108

*All charts created using freestockcharts.com unless otherwise stated
The T2108 Resource Page
Expanded daily chart of T2108 versus the S&P 500
Expanded weekly chart of T2108
Be careful out there!
Full disclosure: long TLT call options, net long U.S. dollar, short the euro, long UVXY call options, long SSO put options