
(T2108 measures the percentage of stocks trading above their respective 40-day moving averages [DMAs]. It helps to identify extremes in market sentiment that are likely to reverse. To learn more about it, see my T2108 Resource Page. You can follow real-time T2108 commentary on twitter using the #T2108 hashtag. T2108-related trades and other trades are occasionally posted on twitter using the #120trade hashtag. T2107 measures the percentage of stocks trading above their respective 200DMAs)
T2108 Status: 45.3%
T2107 Status: 47.2%
VIX Status: 15.7
General (Short-term) Trading Call: Staying bearish until new all-time high or oversold. Fading rallies
Active T2108 periods: Day #102 over 20%, Day #61 above 30%, Day #5 above 40% (overperiod), Day #8 under 50%, Day #8 under 60%, Day #172 under 70%
Reference Charts (click for view of last 6 months from Stockcharts.com):
S&P 500 or SPY
SDS (ProShares UltraShort S&P500)
U.S. Dollar Index (volatility index)
EEM (iShares MSCI Emerging Markets)
VIX (volatility index)
VXX (iPath S&P 500 VIX Short-Term Futures ETN)
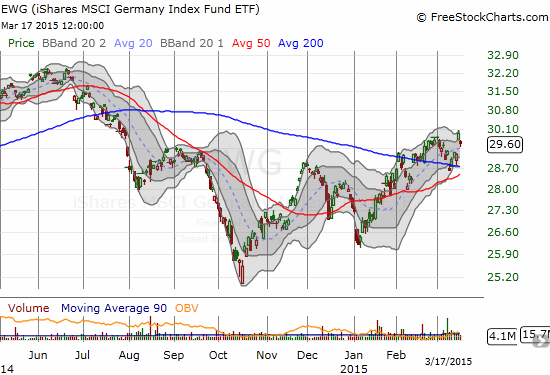
EWG (iShares MSCI Germany Index Fund)
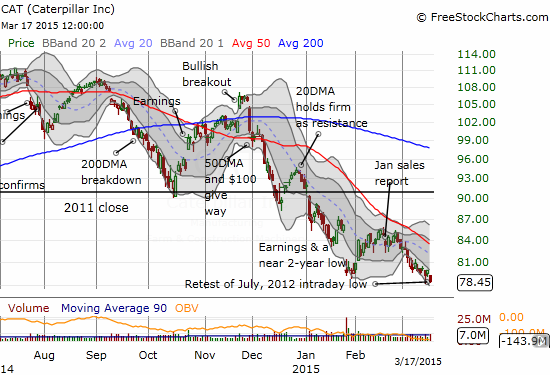
CAT (Caterpillar).
Commentary
The stock market is ALMOST right where I left it after my last T2108 Update on March 12th. On the 13th, I seemed to nail the pre/post-Fed trade narrative when the S&P 500 (SPY) reversed its entire gain from the previous day. However, the index bounced from the lows, reversed half its loss, and it is now floating above its 50DMA all over again.
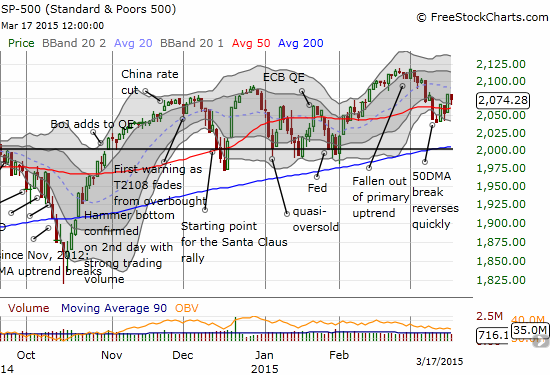
Interestingly, while the S&P 500 has made some progress, T2108 and the VIX are both still stuck where I last left them. This is not quite a bearish divergence, but it once again makes me suspicious of the S&P 500’s move higher. So, the trading call remains firmly bearish despite the index’s ability to trade above its 50DMA.
I made some changes to my T2108 trade. On Friday, I took advantage of the reversal and sold almost half my put options in ProShares Ultra S&P500 (SSO). Of course, I wish I had sold them all. I left a decent profit on the table in my last round of call options on ProShares Ultra VIX Short-Term Futures (UVXY). Only a BIG post-Fed disappointment can put these back into the green at this point. I also took profits on long side of my hedged play on iShares MSCI Emerging Markets (EEM). I am now sitting on completely unhedged EEM put options.
The surprising calm going into the Federal Reserve’s next decision on monetary policy has me thinking that the reverse of my expectations will play out. That is, instead of the Fed feeling a need to calm markets down and assure them as usual, the Fed might actually take this opportunity to make it abundantly clear that rates are about to go up. I fully expect the market to reverse under such a scenario. However, I highly doubt such a pullback will lead to sustained and major selling, so under such a scenario I will look to significantly reduce my bearish bets. T2108 is still just in the mid 40s anyway. (I am REALLY disappointed that the market is not set up for my favorite post-Fed fade volatility trade!).
If the market makes it through the Fed just fine, then I am back to neutral mode waiting to see what happens on the next retest or visit to overbought territory.
Now for some charts while we wait. My commentaries are in the captions of the charts. As always, I allow for some wiggle room when it comes to individual stocks versus my overall market trading call.
Daily T2108 vs the S&P 500
")
Black line: T2108 (measured on the right); Green line: S&P 500 (for comparative purposes)
Red line: T2108 Overbought (70%); Blue line: T2108 Oversold (20%)
Weekly T2108

*All charts created using freestockcharts.com unless otherwise stated
The T2108 Resource Page
Expanded daily chart of T2108 versus the S&P 500
Expanded weekly chart of T2108
Be careful out there!
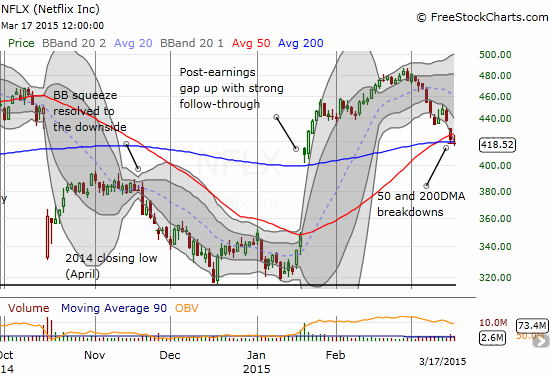
Full disclosure: long EWG call options, short NFLX and long NFLX calls, long EEM puts, long SSO puts, long UVXY calls