
(T2108 measures the percentage of stocks trading above their respective 40-day moving averages [DMAs]. It helps to identify extremes in market sentiment that are likely to reverse. To learn more about it, see my T2108 Resource Page. You can follow real-time T2108 commentary on twitter using the #T2108 hashtag. T2108-related trades and other trades are sometimes posted on twitter using the #120trade hashtag. T2107 measures the percentage of stocks trading above their respective 200DMAs)
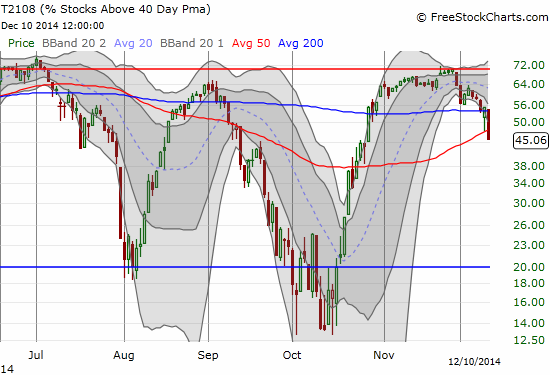
T2108 Status: 45.1%
T2107 Status: 45.3%
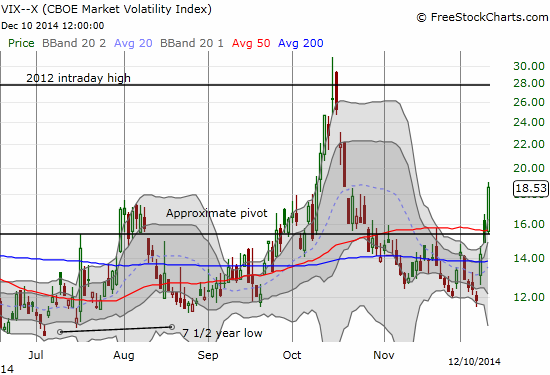
VIX Status: 18.5 (jumped 24.5%)
General (Short-term) Trading Call: Hold. Caveats listed below.
Active T2108 periods: Day #37 over 20%, Day #35 over 30%, Day #32 over 40%, Day #1 under 50% (underperiod, ending 29 days over 50%), Day #5 under 60%, Day #107 under 70%
Reference Charts (click for view of last 6 months from Stockcharts.com):
S&P 500 or SPY
SDS (ProShares UltraShort S&P500)
U.S. Dollar Index (volatility index)
EEM (iShares MSCI Emerging Markets)
VIX (volatility index)
VXX (iPath S&P 500 VIX Short-Term Futures ETN)
EWG (iShares MSCI Germany Index Fund)
CAT (Caterpillar).
Commentary
Wow: A staggering bond rally: 3 yrs 2.2%; 10 yrs 2.8%. The recessionary like conditions showing up in commodity price free fall is now scary
— Stephen Koukoulas (@TheKouk) December 10, 2014
The above tweet comes from an Australian economist whom I follow relatively closely as a check on my views about the Australian and global economy. The rates are on Australian bonds, but bond yields are falling all over the globe. I post it as just one example of a very palpable fear I feel is growing as commodity prices continue tumbling seemingly with no end. Such an extended collapse is simply not part of our normal (recent) experience, so assumptions and conclusions that demand is plummeting in places like China strike a very loud chord. Then again, commodity prices got to current levels after a run-up that had not been seen for a very long time either. Here is an example from Australia’s latest commodity price index.
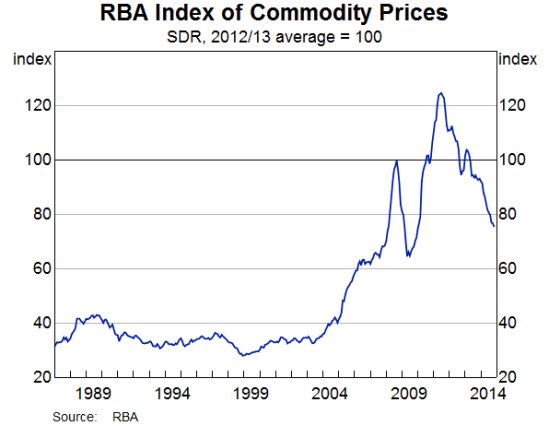
Source: Reserve Bank of Australia
Note very well that this collapse in commodity prices has unfolded for 3 1/2 years. Thus, it makes little sense to say “the market is going down because commodity prices are plunging.” Perhaps commodities finally reached a tipping point, like adding oil to the plunge, but clearly the story is more complex with the S&P 500 just a few percentage points off all-time highs.
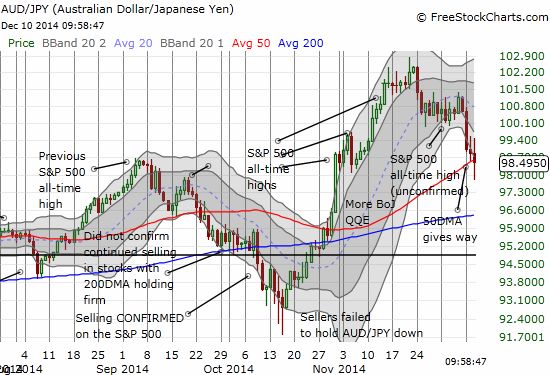
Having said all that, traders must fully appreciate the havoc that can descend upon market sentiment when unusual events are happening with no end in sight. Until market participants think they have a sense for just how far oil might go, the oil-related “disaster” narrative will take a firm hold on minds and hearts. Bottom-line, the early warning from T2108 and then Caterpillar’s (CAT) reversal and now a confirmation from the Australian dollar/Japanese yen combination (AUD/JPY) should be assessed very seriously. The chop on the way to this point has been distracting from the fundamental message that some kind of top seems to have appeared.
Now, the charts.
T2108 plunged a massive 10 percentage points. This means a LOT of stocks are breaking critical technical levels all at once. As a reminder, T2108 was our earliest warning signal that “something” was not right with the stock market – its descent began on November 28th, Black Friday.
The S&P 500 (SPY) was unable to muster any buying interest off the lows today, unlike yesterday. Trading volume was very strong, and the index “punched” its lower-Bollinger Band (BB) hard enough to bend it downward…a classic warning sign of an imminent continuation move. A retest of the 50-day moving average (DMA) seems almost certain now…especially with it coinciding with the round number 2000. The index has failed to confirm the bullish hammer pattern from the day before. It has also invalidated the breakout from the surprise rate cut from China by filling the gap up and closing below the low before the gap.

The volatility index provides an emphatic confirmation of the selling pressure and sharp (relative) surge in fear.
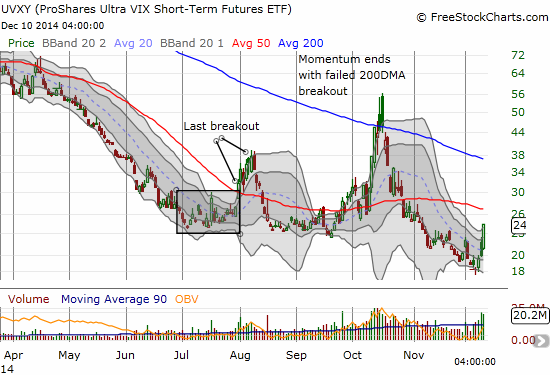
ProShares Ultra VIX Short-Term Futures (UVXY) responded in kind with a 24% pop. I clearly was not expecting anything close to such a pop given I sold my UVXY call options yesterday. I have switched now to my more comfortable positioning of fading UVXY with some put options expiring next Friday. I am fully expecting next week’s Federal Reserve meeting to be another volatility killer.
Finally, AUD/JPY provided all the confirmation I needed of a refreshed bear. This important currency pair punched through 50DMA support as its breakdown from recent highs continues.
So now it seems my sale of my ProShares Ultra S&P500 (SSO) shares yesterday was timely even as my sale of UVXY call options was premature. As planned, I sold my Caterpillar (CAT) put spread given little remaining upside exists with the stock dropping well past the low point of the put spread (100/95). I closed out some short positions (like CSIQ – a play whose theme is explained in “Solar Stocks And Oil: A Potential Setup For A Solar Relief Rally In 2015“).
Overall, I am on alert. Given the chop since the November 21st breakout and my expectation for more chop, I will not be surprised by additional fake-out moves. The good news is that this chop provides almost daily trading opportunities to the upside and downside. The bad news is that it will continue to be easy to get distracted from the main storyline: a topping market whose longer-term uptrend remains well-intact – that is, consider bearish opportunities to be temporary opportunities and continue looking for good entries to buy the dip.
I feel freer to short individual stocks that meet strict technical criteria. I am not a bear, just a protective bull. With T2108 already at 45%, I know I need to pay close attention to the distant horizon where oversold conditions may await the market’s arrival. Ideal oversold conditions, T2108 less than 20%, would occur right as the S&P 500 is testing its 50DMA and even better if the volatility index is soaring at the same time to or past the previous high point. But I know how the market loves to ignore the specifics of my desires…
Finally, per my trading calls, bulls should have already taken some profits. Hopefully you feel comfortable with the leftovers on your plate. You should try to ride out those remaining positions through the coming storm and look forward to buying from your shopping list at a discount.
Daily T2108 vs the S&P 500
")
Black line: T2108 (measured on the right); Green line: S&P 500 (for comparative purposes)
Red line: T2108 Overbought (70%); Blue line: T2108 Oversold (20%)
Weekly T2108

*All charts created using freestockcharts.com unless otherwise stated
The T2108 Resource Page
Expanded daily chart of T2108 versus the S&P 500
Expanded weekly chart of T2108
Be careful out there!
Full disclosure: net short the Australian dollar; net long U.S. dollar; net short Japanese yen; long UVXY put options