
(T2108 measures the percentage of stocks trading above their respective 40-day moving averages [DMAs]. It helps to identify extremes in market sentiment that are likely to reverse. To learn more about it, see my T2108 Resource Page. You can follow real-time T2108 commentary on twitter using the #T2108 hashtag. T2108-related trades and other trades are sometimes posted on twitter using the #120trade hashtag. T2107 measures the percentage of stocks trading above their respective 200DMAs)
T2108 Status: 44.6%
T2107 Status: 45.2%
VIX Status: 18.5 (8.4% increase after jumping 24.5% the day before)
General (Short-term) Trading Call: Hold. Caveats listed below.
Active T2108 periods: Day #38 over 20%, Day #36 over 30%, Day #33 over 40%, Day #2 under 50% (underperiod), Day #6 under 60%, Day #108 under 70%
Reference Charts (click for view of last 6 months from Stockcharts.com):
S&P 500 or SPY
SDS (ProShares UltraShort S&P500)
U.S. Dollar Index (volatility index)
EEM (iShares MSCI Emerging Markets)
VIX (volatility index)
VXX (iPath S&P 500 VIX Short-Term Futures ETN)
EWG (iShares MSCI Germany Index Fund)
CAT (Caterpillar).
Commentary
Since 1990 (as far back as the data from Yahoo!Finance goes), there have been just 197 trading days where the VIX increased by 3% or more and the S&P 500 maintained a positive gain on the day. The number of days drops to 79 for VIX increases of 5% or more. There are only 18 trading days since 1990 where the VIX increased by 8% or more and the S&P 500 still managed a gain.
It is very rare to observe a combination of a notable gain for the VIX along with a positive close for the S&P 500 (SPY). Yet, that is exactly what happened today with the VIX making a late day surge to gain 8.4% while the S&P 500 faded fast into the close but managed to hold onto a 0.5% gain. The last time the VIX gained at least 8% while the S&P 500 closed in the green was December 30, 2004. The VIX gained 8.1% while the S&P 500 barely eked out a positive gain of just .008%. The next to last time was May 5, 1997 when the VIX soared 15.0% even as the S&P 500 managed to gain 2.1%. This record is out of 6,276 trading days (January 3, 1990 to November 25, 2014)!
I am not yet sure what to make of this rare event (I am open to ideas!). It will take more time to run through a few possibilities and do some research. One possibility is that some big trader(s) rushed to make unhedged bets on future price levels for the S&P 500; that is, bets on options without simultaneous purchases or shorts on the S&P 500, or at least simultaneous trades that were not big enough to drive the S&P 500 into negative territory. This is pure speculation on my part. Even if my explanation has merit, I am not sure what larger implications could or should be drawn. Anyway, let’s look at the related charts.
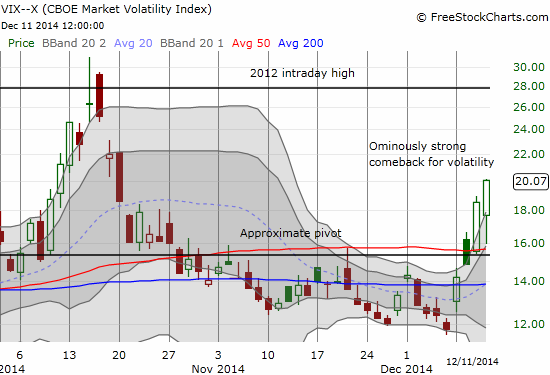
Note that the VIX opened with a gap down from Wednesday’s close that took the VIX right to its upper-BB. The pullback continued right to the 50DMA and just above the 15.35 pivot. This was the perfect scenario for the put options on ProShares Ultra VIX Short-Term Futures (UVXY) that I purchased toward Wednesday’s close. After failing to see follow-through, I quickly closed out the position. It felt like the eventual pullback I wanted came much earlier than expected.
I was further surprised when near Thursday’s close I discovered that the VIX was surging again. My reflexes sent me to purchase a fresh tranche of put options on UVXY (recall that I am expecting volatility to implode right before or after next week’s Fed meeting). NEXT, I searched around for an explanation of the sharp turn-around. It was then I noticed that the S&P 500 was weakening fast into the close. It was a dramatic turn-around from what was looking like an equally dramatic reversal of Wednesday’s loss.
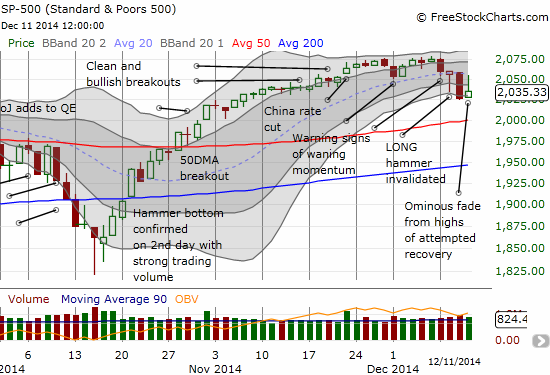
What at first looked like a huge victory for the bulls now looks like another sign of the growing strength of the bears. Recall that with the lower-BB opening downward, traders should expect a downward bias to the S&P 500 in the immediate short-term. I still expect at some point sooner than later a retest of the 50DMA. That expectation is what has me staying opportunistic with the UVXY put options. While the depth of the reversal surprised me, the topping of the S&P 500 on the day did not.
$AUDJPY now looks like it has peaked for the day. Assuming correlations remain strong, $SPY has peaked for the day as well. #forex
— Dr. Duru (@DrDuru) December 11, 2014
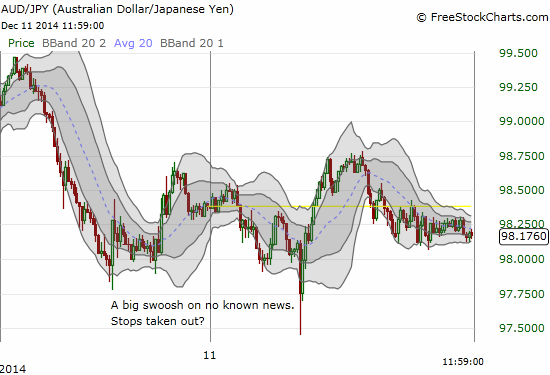
Once again, the Australian dollar (FXA) versus the Japanese yen (FXY) delivered a powerful indicator for the general market. AUD/JPY is still below its 50DMA and flagging a bearish signal. However, U.S. trading started with a relatively bullish signal from AUD/JPY after a large swoosh downward was quickly reversed.
Big swoosh down ~5am Eastern in the Australian dollar, especially $AUDJPY. Classic intraday bottoming. Supports positive $SPY today #forex
— Dr. Duru (@DrDuru) December 11, 2014
Here is the 15-minute intraday chart:
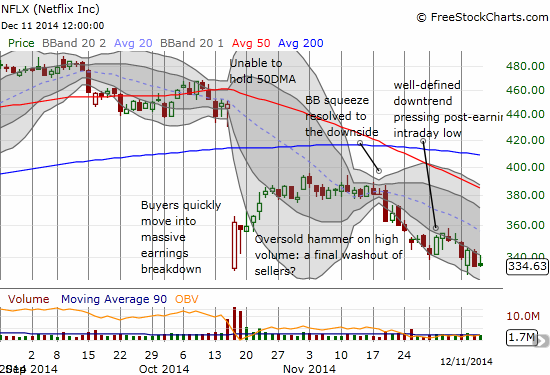
After I concluded that the S&P 500 had topped for the day, I looked around for some potentially highly profitable targets for put options. At the top of my list: Netflix (NFLX). At the time, NFLX was hitting its high for the day that happened to coincide with the top of its current downward channel – a great risk/reward opportunity for a fade. NFLX delivered very well by the close, and I took the profits (I am still sitting on my put spread).
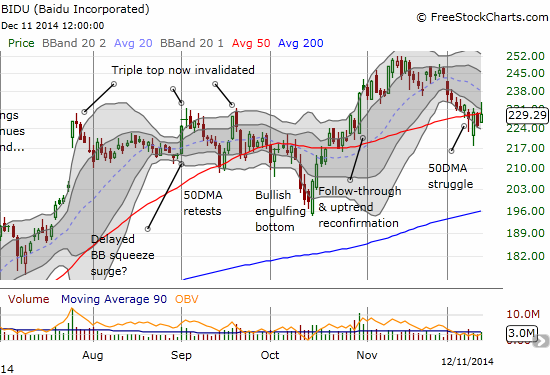
I did not open any other bearish bets on the AUD/JPY signal although I was tempted by Baidu (BIDU). The stock is struggling mightily at 50DMA resistance as it stays trapped within its own downward channel defined by the two lower Bollinger Bands. It is getting more and more difficult for me to stay bullish on BIDU.
Amazon.com (AMZN) is a stock I should have considered. The stock is also struggling with a 50DMA that is acting as tough resistance. Today’s fade was particularly ominous for AMZN. So perhaps investors are getting weary with the AMZN profitless story after all. A friend recommended a recent Seeking Alpha piece on AMZN titled “Amazon’s Moment of Truth May Have Arrived.” This piece is probably one of the most convincing bearish pieces I have read on AMZN; perhaps because it presented an angle I had never seen before. The author noted that it seems likely that an end is soon coming to AMZN’s ability to borrow cheaply using the huge gap in time between the time it pays suppliers and the time it collects money for goods. With the lower-BB opening downward and four days in a row with failures at resistance, odds are increasing that AMZN will soon retest its post-earnings low.
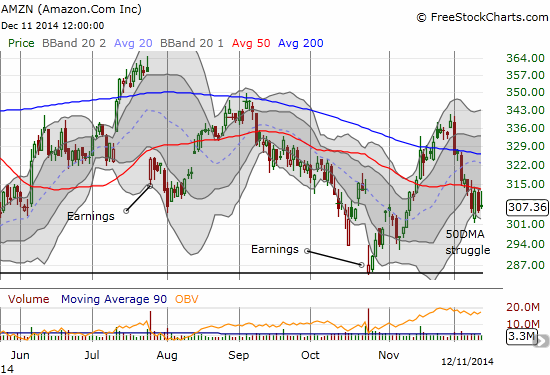 Amazon.com (AMZN) seems to be losing the fight with 50DMA resistance[/caption]
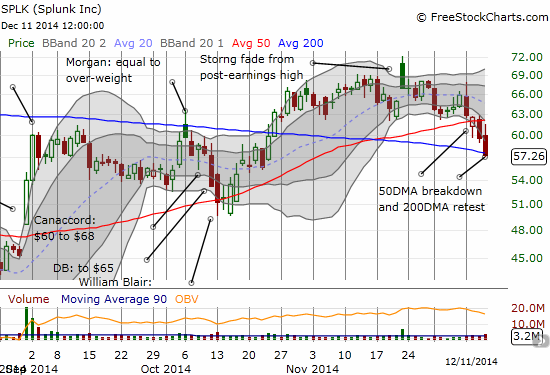
A particularly good trade would have been Splunk (SPLK). I have written skeptically about the company in the past because of massive insider sales and a super-rich valuation. The stock gapped higher after its November earnigns report and proceeded to fade from there (a “gap and crap”). The stock has continued sliding, including a 50DMA breakdown and now a critical retest of 200DMA support.
I continue to expect a lot of chop for the market overall going into year-end. As a result, I am not holding fresh trades for long (like UVXY) if I quickly recognize a sizeable profit. Trading opportunities for bears and bulls, even for those who insist on being dogmatic about their positioning. The overall bias is downward given all the signals I pointed out in the last T2108 Update.
Daily T2108 vs the S&P 500
")
Black line: T2108 (measured on the right); Green line: S&P 500 (for comparative purposes)
Red line: T2108 Overbought (70%); Blue line: T2108 Oversold (20%)
Weekly T2108

*All charts created using freestockcharts.com unless otherwise stated
The T2108 Resource Page
Expanded daily chart of T2108 versus the S&P 500
Expanded weekly chart of T2108
Be careful out there!
Full disclosure: long NFLX put spread, long BIDU call and put options, short AUD/JPY, short SPLK and long SPLK call options
One guess about what drove VIX yesterday: low but non-zero probability of a government shutdown if Boehner can’t find enough votes to pass the budget. The current budget bill repeals the Dodd-Frank regulation that blocked use of federally insured money to play derivatives; repeal is unacceptable to many.
I hadn’t considered that possibility. It seemed like thise possibility of a govt shutdown is remote enough that it is not worth anyone’s money betting on it. Regardless, it is still strange that a drive of surging volatility was not enough to take the S&P 500 into negative territory.