(T2108 measures the percentage of stocks trading above their respective 40-day moving averages [DMAs]. It helps to identify extremes in market sentiment that are likely to reverse. To learn more about it, see my T2108 Resource Page. You can follow real-time T2108 commentary on twitter using the #T2108 hashtag. T2108-related trades and other trades are posted on twitter using the #120trade hashtag)
T2108 Status: 56.6%
VIX Status: 12.6 (fades hard into the close)
General (Short-term) Trading Call: Hold. Stop for longs on the S&P 500 remains at 1962
Active T2108 periods: Day #254 over 20%, Day #106 over 40%, Day #33 over 60% (overperiod), Day #4 under 70% (underperiod)
Reference Charts (click for view of last 6 months from Stockcharts.com):
S&P 500 or SPY
SDS (ProShares UltraShort S&P500)
U.S. Dollar Index (volatility index)
EEM (iShares MSCI Emerging Markets)
VIX (volatility index)
VXX (iPath S&P 500 VIX Short-Term Futures ETN)
EWG (iShares MSCI Germany Index Fund)
CAT (Caterpillar).
Commentary
1962 on the S&P 500 is still holding…just barely. The current trading call holds with it. (Yes, this is a deja vu moment from the last T2108 Update!)
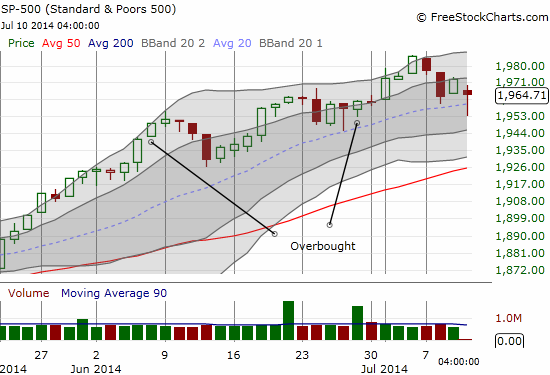
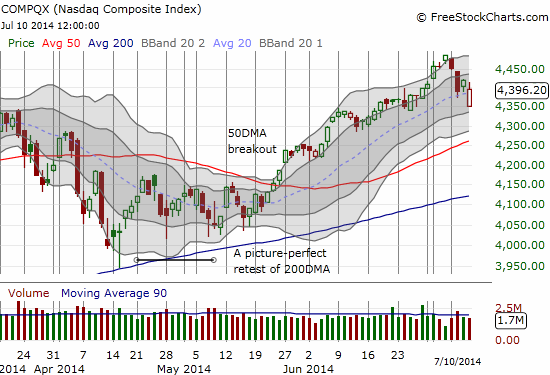
I was VERY tempted to buy the gap down given the common behavior of traders to buy these gaps in the middle of an uptrend, but I left it alone. Soon after trading opened in the U.S., I even saw a likely signal that the gap down would not last.
Airline stocks zipped off bottom, back in green. Early indicator that the latest market "burp", may not last long. $AAL $DAL $SPY on watch!
— Dr. Duru (@DrDuru) July 10, 2014
Instead of buying the gap, I went after puts on ProShares Ultra VIX Short-Term Fut ETF (UVXY). I like this play better because volatility is likely to sink even if the index just stands still. I also like fading volatility because all around are signs that volatility is still not ready to stand its ground. Here are a few examples…
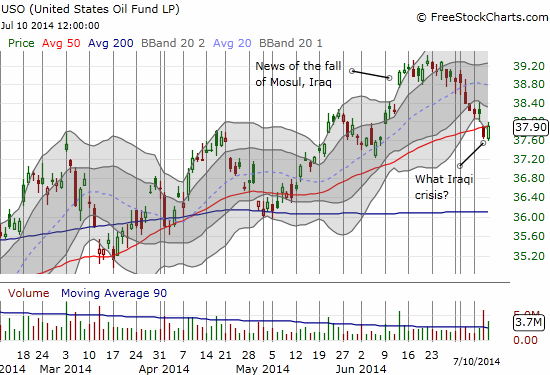
Incredibly, oil has been in a steady slide for over two weeks. The Iraq-related pop in June never received any follow-through.
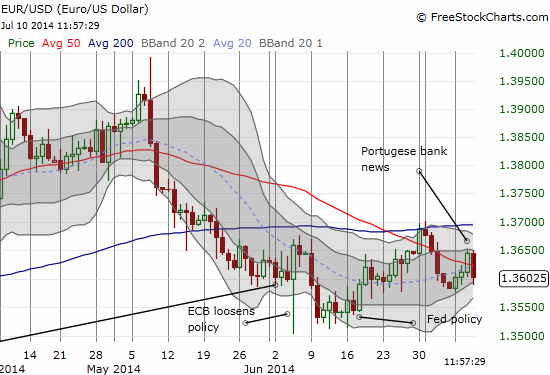
Eurozone fears from a Portugese bank supposedly triggered the market jitters. Not only did buyers seem fit to go after the gap down in the major indices but currency traders only reluctantly let the euro decline. It is nowhere near ringing alarm bells as it did not even manage a fresh post-ECB easing low.
I am far from encouraging complacency. I am arguing for good technicians to keep their eye on the action – what money is really doing. The bears currently are being particularly egregious in grasping at every possible negative headline as the sign that a long-awaited top or crash has finally arrived. (I gave up on my March call for a top when the S&P 500 made a fresh breakout in late May). It is much easier to trigger bearish trades on the (confirmed) breach of a critical level, like S&P 500 under 1962, or a major fade in the middle of overbought conditions, than to try to outguess and outsmart what the market really cares about. It is ALWAYS possible the market understands something better than you do – and you can bet if that is the case, the market has much more money to follow its thesis than you have to fight it. If you chose to fight anyway, at least try to define the risk and the stops ahead of time! A hard lesson I sometimes relearn when I fall back on my contrarian biases (for example, keep reading below…).
T2108 made a huge comeback along with the market yet it still declined by 8.5% at the close. Another steep drop may finally close the S&P 500 below the 1962 level, but I will then need to contend with the conflicting signal of quasi-oversold conditions. Stay tuned on that one.
I conclude with consumer discretionary – Consumer Discretionary Select Sector SPDR ETF (XLY). This sector is supposed to out-perform in the second half of the year if all goes well. My first attempt at playing this theme, zulily (ZU), has not worked out too well yet with the stock breaking down below its 50DMA support on Monday. It reminded me that trying to hand pick individual consumer discretionary is full of hazards. Today’s plunge in Lumber Liquidators Holdings (LL) was an even more powerful reminder.
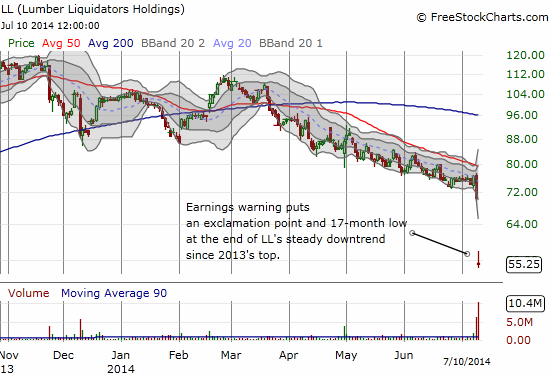
Note first how the steady downtrend just kept screaming out something is seriously broken. Even MORE interesting is the surge in selling volume just ahead of the earnings warning. Hmmm….
Anyway, I took special interest in this disaster because of what it potentially says about the (resale) housing market. Moreover, the stock plunged well below its lower Bollinger Band (BB), a perfect put-selling opportunity assuming the news is not a complete mess. I decided to take some encouragement in the company’s claim that there is light at the end of the tunnel. If the market eventually also believes this, the premium on the put I sold should sink quickly. The stock could even make a decent recovery by my expiration date in November, just in time for what history says is a generally strong period for consumer discretionary. This play strongly assumes that the tremendous selling volume after an extended downtrend is a sign that the decline is closer to the end than the beginning – again, absent completely disastrous news.
“Customer traffic to our stores was significantly weaker than we expected, particularly in geographic areas severely impacted by the unusually harsh weather in the first quarter. The improvement in customer demand we experienced beginning in mid-March did not carry into May, and June weakened further. Our reduced customer traffic has coincided with certain weak macroeconomic trends related to residential remodeling, including existing home sales, which have generally been lower in 2014 than the corresponding periods in 2013. We now believe the prolonged purchase cycle associated with our customers’ discretionary, large-ticket home improvement projects is likely to be delayed for some customers into the fall flooring season, and for others, into spring of 2015.
…In certain key merchandise categories, primarily laminates, vinyl plank and engineered hardwoods, lower than planned inventory levels reduced our ability to convert customer interest into invoiced sales. Certain mills experienced production delays in meeting our open orders as we continued to enhance our quality assurance requirements. We estimate an aggregate net sales shortfall in the second quarter of up to $18 million in those products impacted. We expect full product availability for our customers during the third quarter, with no material impact to our product costs
…Though we continue to believe we are early in a multi-year housing recovery that will drive home improvement spending, a number of the factors weighing on our second quarter results are likely to continue in the second half of 2014. We are focused on continuous improvement in our operations, strengthening our leadership in product price and quality and elevating customer recognition of our superior value proposition. While we believe the third quarter may be weaker than we originally anticipated, we have a strong sense of urgency and we expect to regain traction to deliver operating margin expansion in the second half and in coming years. We remain confident in the long-term strength of our business model and believe that the investments we have made in our strategic initiatives will continue to drive market share gains in the future.”
Note well that I am not staking a claim that investors and traders SHOULD buy LL from here. Indeed, I would be very surprised by such a quick turn-around. Instead, I am looking at the technicals of a likely washout type of move. I made the trade on the same day because the fear premium on the puts can fade very quickly depending on trading conditions from here. Those buying shares need to be a bit more careful in waiting for some kind of confirmation of renewed buying interest. Selling puts also requires a willingness to take eventual ownership of the shares at the implied discount (similar to the play I described here and executed on Twitter post expiration of its lock-up). Looking at the longer-term recovery in housing, I think this play is well worth the risk…again as supported by my read on the technicals.
In the meantime, I will be looking for a good dip to buy the “safer” play of XLY if market angst actually does widen in the coming weeks…
Daily T2108 vs the S&P 500

Black line: T2108 (measured on the right); Green line: S&P 500 (for comparative purposes)
Red line: T2108 Overbought (70%); Blue line: T2108 Oversold (20%)
Weekly T2108

*All charts created using freestockcharts.com unless otherwise stated
Related links:
The T2108 Resource Page
Expanded daily chart of T2108 versus the S&P 500
Expanded weekly chart of T2108
Be careful out there!
Full disclosure: long UVXY puts, net short the euro, long ZU, short LL puts
