
(T2108 measures the percentage of stocks trading above their respective 40-day moving averages [DMAs]. It helps to identify extremes in market sentiment that are likely to reverse. To learn more about it, see my T2108 Resource Page. You can follow real-time T2108 commentary on twitter using the #T2108 hashtag. T2108-related trades and other trades are posted on twitter using the #120trade hashtag)
T2108 Status: 61.7%
VIX Status: 12.0 (fades hard into the close)
General (Short-term) Trading Call: Hold. Stop for longs on the S&P 500 remains at 1962
Active T2108 periods: Day #252 over 20%, Day #104 over 40%, Day #31 over 60% (overperiod), Day #2 under 70% (underperiod)
Reference Charts (click for view of last 6 months from Stockcharts.com):
S&P 500 or SPY
SDS (ProShares UltraShort S&P500)
U.S. Dollar Index (volatility index)
EEM (iShares MSCI Emerging Markets)
VIX (volatility index)
VXX (iPath S&P 500 VIX Short-Term Futures ETN)
EWG (iShares MSCI Germany Index Fund)
CAT (Caterpillar).
Commentary
1962 on the S&P 500 is still holding…just barely. The current trading call holds with it.
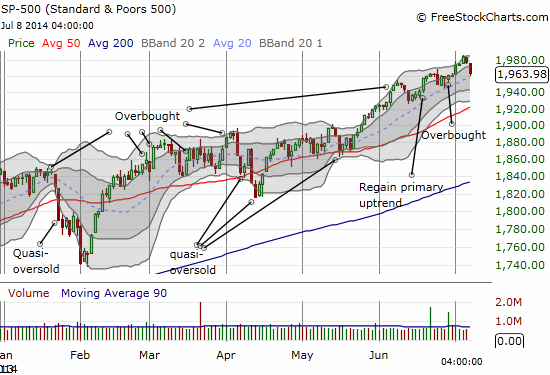
T2108 plunged again and confirmed with an exclamation point the end of the last overbought period. NOW things get interesting. As I have explained in previous posts, I am VERY hesitant to switch to a bearish trading call even as the money to be made right now is on quick shorts of momentum and high multiple stocks. This tweet by my old trading mentor underlines my hesitation (if the embedded tweet does not work for you, click the link and look at his news feed for July 8th):
$SABR has had quite a string of NR7s over the last week (5 in a row) while forming a pennant. A true coiled spring. http://t.co/rvVy8QG2I5
— Michael Seneadza (@TraderMike) July 8, 2014
The impact of the churn in and out of overbought conditions is that I have only placed ONE T2108-related trade. That was a quick successful roundtrip in and out of SSO call options last week. Other than that, everything has been on individual stocks according to individual charts with “guidance” from the T2108 trading call.
I think some over-eager bears are going to get whiplash, especially with earnings approaching and higher odds of analysts making pre-emptive assessments and/or defending fallen angels. I took advantage of several plunges to increase the bullish side of hedged short positions. Netflix was the biggest one.
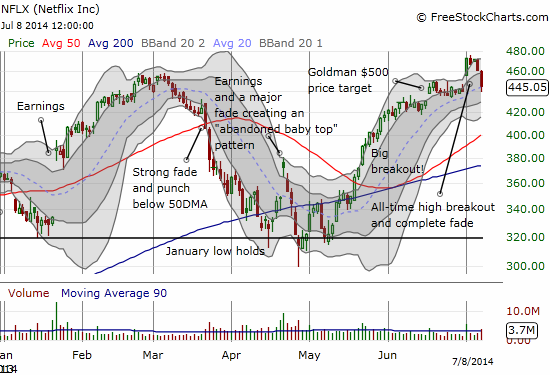
I have explained this trade in earlier posts. With NFLX back to its previous all-time high on a complete reversal of the breakout gains, I get a second chance to play this one correctly. Ahead of the breakout, I failed to follow my intuition and close out the short side of my call spread. Not this time! Note that it is VERY bearish for NFLX to reverse this breakout. The bearish setup gets confirmed on a lower close.
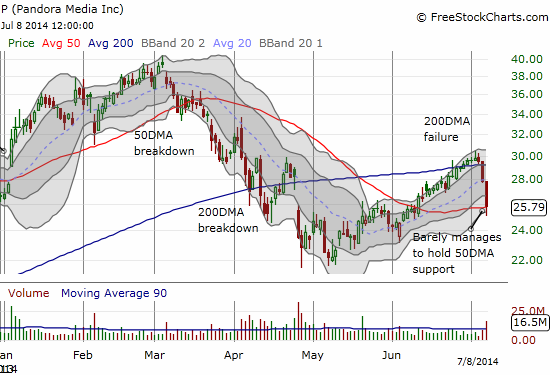
Pandora (P) is a longer-term bearish play, independent of the T2108 trading calls. One day, this stock will be single digits. There is just too much competition even for a company with a solid user base and great technology. With Apple (AAPL) and Google (GOOG) and more to come seeing the opportunity in this space, the high multiple and valuation premium simply make no sense (53 forward P/E and 7.8x sales). Anyone who has been around to see several of these cycles knows this story all too well. The companies in these positions never say the competition is a threat until it is too late for investors to save a good chunk of change. However, since it is always dangerous for a trader without VERY deep pockets to short based on valuation (too many people may disagree with you for too long), I have long-term puts with a plan to keep cycling as long as it takes for the stock to finally get to reality. The three days of selling have brought these puts back to even (I have gradually added to the position), but buyers stepped in to defend the 50DMA support level. The stock is thus primed to bounce if the market mood on these high-flying stocks suddenly turns again.
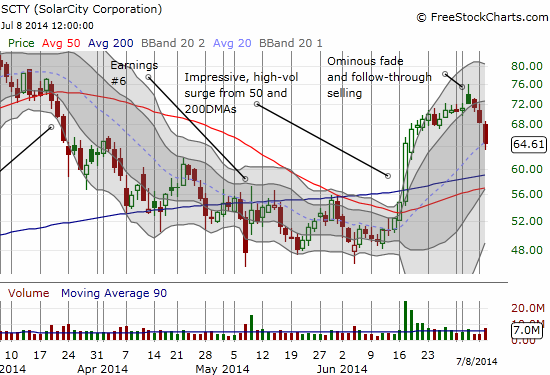
Solar City (SCTY) is one of the many charts I wanted to show in the last T2108 Update but simply did not have the time. SCTY printed a classic topping pattern with a flase breakout and a fade. The subsequent vicious, steep, and sharp selling quickly confirmed that top. Now it is all about how the stock behaves at converging 50 and 200DMA support levels.
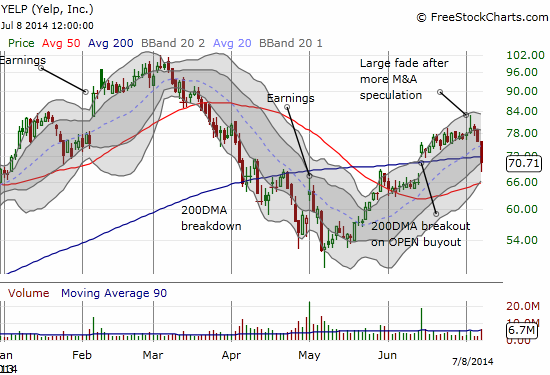
I could go through a bunch more. For example, Yelp (YELP) has confirmed a “top-by-fade” with its selling which turned into high volume selling today. Buyers here were not able to hurdle the stock back over 50DMA support. Given YELP has been driven upward by rampant speculation, it is particularly vulnerable to a continuation of high-volume selling. A close below the 50DMA gets me back to beartown on this one.
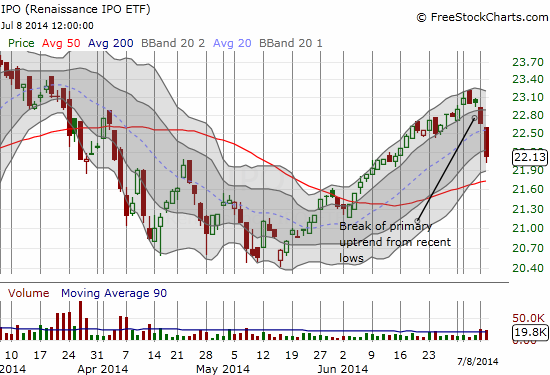
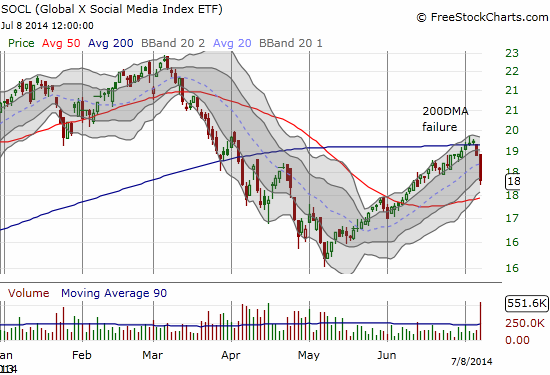
Rather than post chart after similar chart, here are Renaissance IPO ETF (IPO) and Global X Social Media Index ETF (SOCL) as representative of the acceleration in selling.
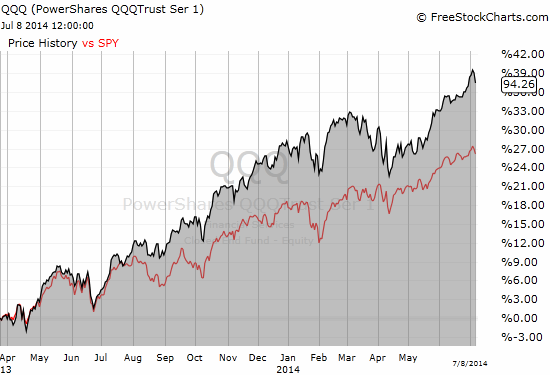
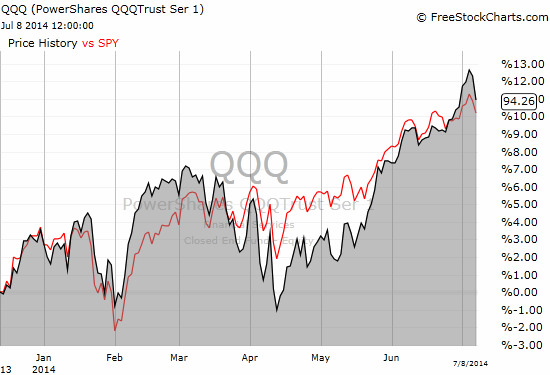
Finally, here are two comparisons of QQQ and SPY. Tech is once again taking the brunt of the current selling. Today, the NASDAQ lost twice as much as the S&P 500 on a percentage basis. However, note that the time window of comparison matters a lot. Tech is still far out-performing the S&P 500 since early 2013. Since late 2013, it has traded places with the S&P 500 and is now losing a brief period of out-performance. I am guessing that a break here will become a new phase of sustained under-performance. So if (when?) the S&P 500 breaks the bull/bear line at 1962, then my bearish focus will be on the NASDAQ and not the S&P 500…along with a wary eye to “buy in July.”
Daily T2108 vs the S&P 500
")
Black line: T2108 (measured on the right); Green line: S&P 500 (for comparative purposes)
Red line: T2108 Overbought (70%); Blue line: T2108 Oversold (20%)
Weekly T2108

*All charts created using freestockcharts.com unless otherwise stated
Related links:
The T2108 Resource Page
Expanded daily chart of T2108 versus the S&P 500
Expanded weekly chart of T2108
Be careful out there!
Full disclosure: long P puts, short NFLX, long NFLX calls and call spread