
(T2108 measures the percentage of stocks trading above their respective 40-day moving averages [DMAs]. It helps to identify extremes in market sentiment that are likely to reverse. To learn more about it, see my T2108 Resource Page. You can follow real-time T2108 commentary on twitter using the #T2108 hashtag. T2108-related trades and other trades are posted on twitter using the #120trade hashtag)
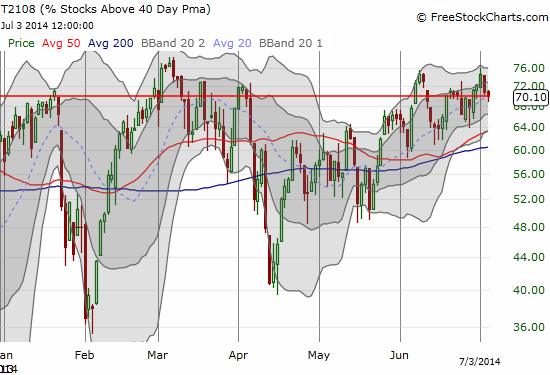
T2108 Status: 70.1% (overbought day #5)
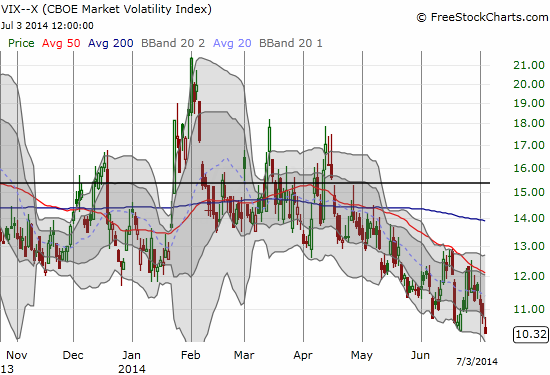
VIX Status: 10.3 (fresh 7-year low)
General (Short-term) Trading Call: Aggressive traders can place new longs. Moving stop up to 1962 on the S&P 500
Active T2108 periods: Day #250 over 20%, Day #102 over 40%, Day #29 over 60%, Day #5 over 70% (overperiod)
Reference Charts (click for view of last 6 months from Stockcharts.com):
S&P 500 or SPY
SDS (ProShares UltraShort S&P500)
U.S. Dollar Index (volatility index)
EEM (iShares MSCI Emerging Markets)
VIX (volatility index)
VXX (iPath S&P 500 VIX Short-Term Futures ETN)
EWG (iShares MSCI Germany Index Fund)
CAT (Caterpillar).
Commentary
The major indices made major pushes to fresh multi-year and all-time highs on the heels of another strong jobs report. The S&P 500 (SPY) and the NASDAQ (QQQ) continue pushing higher up the upper-Bollinger Band in a very strong primary uptrend.
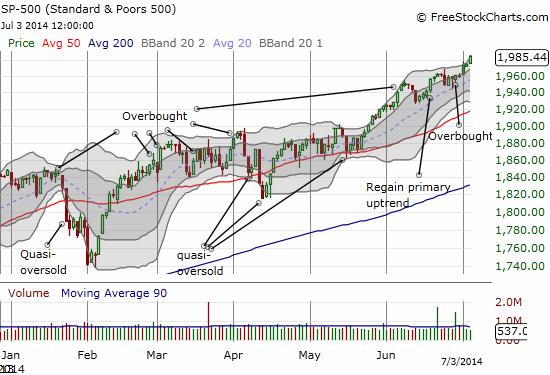

Strangely enough, T2108 did NOT follow the market the last two days. In fact, it briefly dropped OUT of overbought territory during abbreviated pre-July 4th trading. This divergence completely surprises me. I do not know what to make of it, and I am once again hesitant to call this a bearish divergence. However, to accommodate the increased risk, I increased the stop on bullish positions on the S&P 500. Note that I sold my ProShares Ultra S&P500 (SSO) call options into the surge that started the second half of the year. I was primed to sell given I anticipated a strong beginning of the month rally in the last T2108 Update. I am starting to wonder whether quarters have an even higher chance of starting on strong footing, and I definitely need to crunch the numbers.
Surprise, surprise, volatility in the form of the VIX fell to a fresh 7-year low. This drop added an exclamation point to the rally on the major indices.
In the wake of the strong start to the second half of the year, Nightly Business Report rolled out some important stats…all bullish. I hope to confirm them soon with my own look at the numbers.
- July tends to be the strongest month of the year.
- The second half the year has tended to start strongly the past few years.
- Consumer discretionary has been the strongest sector in the second half of the year since 2009. Apparently, these stocks ride the hype of Christmas-season anticipation.
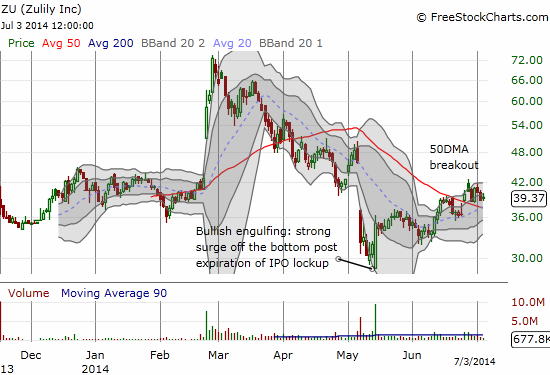
With the third point in mind, I bought shares in Zulily (ZU), a recent IPO in the retail space. I like the setup with the 50DMA breakout right around where the stock first started trading. Retail could be particularly strong this year if the jobs numbers keep up their strong pace (strong caveat on the income/wage numbers).
Here is a review of other charts that have my attention including some trades. This set is not nearly as celebratory as the last (as promised!).
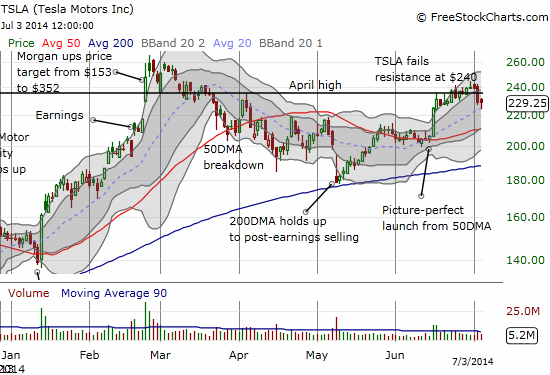
Tesla Motors (TSLA)
My last trade on call options on TSLA failed. I was profitable for a hot minute and decided to hold out for what I thought could be a huge breakout above $240. Instead, TSLA broke down over the last two days. It now looks exhausted. I took advantage of the lower prices to refresh the bullish side of the position with a July call spread. I do not think I need to be aggressive on the long side anymore. I will not be surprised if TSLA makes a quick retest of its 50DMA.
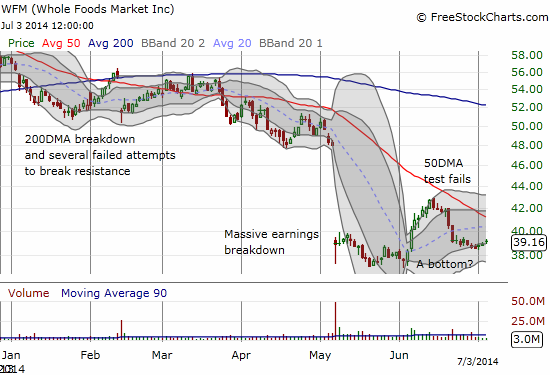
Whole Foods Market (WFM)
I keep checking in on WFM as a potential bottom-feeding stock. I somehow missed the nice pop from the bottom on strong buying volume. I want to buy the dip from failed resistance because I think the next retest will deliver a successful breakout. At least the bottom looks secure for now.
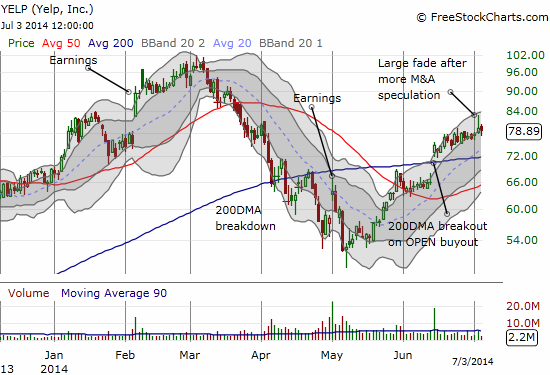
Yelp, INc. (YELP)
My valuation argument on YELP fell flat on its face (surprise, surprise). My put option will undoubtedly expire this month worthless. Fortunately, I conceded defeat on this one and flipped the script to go aggressively bullish. I bought shares and call options and was fortunate to sell both into the spike higher on Wednesday (July 2nd). I am not sure whether I will try another entry, but I definitely get much more interested on a retest of the 200DMA.
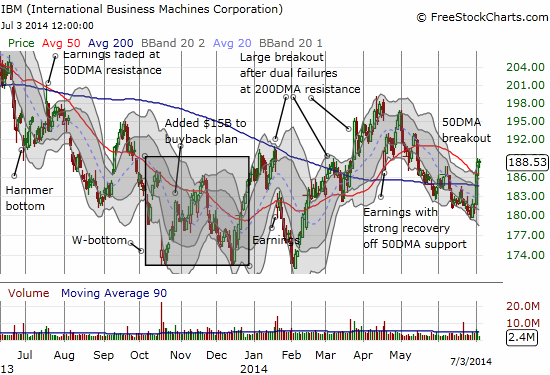
International Business Machines (IBM)
IBM has not been able to shake its extended and wide trading range despite completing a relatively convincing triple bottom in February. I saw the big breakout on July 1st but failed to get a position on. Given my trading call, I have decided to pursue breakouts on individual stocks much more aggressively. The stock ran away from me the next day as it surged off the 50DMA. I next decided to get a little less aggressive and bought July call spreads. I think they should be money good if this breakout is real.
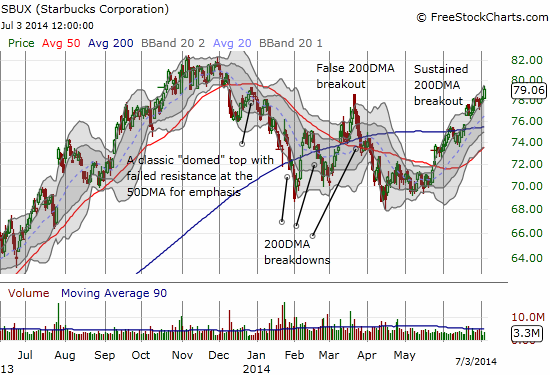
Starbucks (SBUX)
I am so glad I was able to get out of my SBUX short some time ago with a modicum of profit. I do not think I ever want to short SBUX again! The domed top with subsequent 50 and 200DMA breakdowns seemed to demonstrate SBUX’s run was finally coming to an end. With this latest breakout, SBUX is proving its resilience yet again.
Netflix (NFLX)
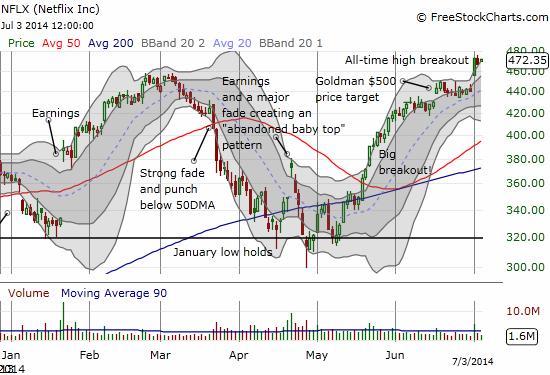
Oh if I had only stayed pure bullish on NFLX! What I thought was impossible – fresh all-time highs – happened on the heels of a hasty upgrade from Goldman Sachs (GS). The analysts there saw fit to go from neutral to a buy and a $500 price target. This upgrade seems late in the game, but the new all-time high essentially confirms the market is ready to take the stock higher and likely quickly. I was prepared with a partial hedge in a fresh call spread. Thank goodness for the last call spread that went out at near full value (a $15 point spread). On the next dip from the all-time high, I added ANOTHER call spread. I am now holding the short position to backstop my return to aggressively betting long on NFLX. Given the stock’s journey, I think it makes sense to stay hedged on any aggressive trades.
Daily T2108 vs the S&P 500
")
Black line: T2108 (measured on the right); Green line: S&P 500 (for comparative purposes)
Red line: T2108 Overbought (70%); Blue line: T2108 Oversold (20%)
Weekly T2108

*All charts created using freestockcharts.com unless otherwise stated
Related links:
The T2108 Resource Page
Expanded daily chart of T2108 versus the S&P 500
Expanded weekly chart of T2108
Be careful out there!
Full disclosure: long TSLA call spread and short TSLA shares, short NFLX shares and long call spreads, long IBM call spreads,
When T2108 diverges from indicators that are based on other collections, I look to its components for the reason. If everyone is buying a certain kind of stocks, T2108 will under-perform indexes that are more strongly weighted toward those. T2108 is a % of NYSE stocks (minus funds and a few other esoteric categories).
The S&P 500, Nasdaq composite, and most of all QQQ, are more heavily weighted toward tech stocks, particularly big-cap tech stocks (AAPL is currently 3.21% of the S&P 500; GOOG 1.89%; MSFT 1.78%; V 1.17%; T 1.05%; IBM 1.02%).
I agree. I just have never been able to allocate time to create a template for systematically studying this or creating a method for quickly narrowing down what is causing the divergence. Anecdotally, I happened to notice a collection of high-multiple/momentum stocks that have finally slowed down in their recoveries. I am thinking there is some element of slowdown in those bounces causing the divergence. So, at least, I think it is a safe bet to say that “safer”, big cap stocks suddenly gained relative favor last week.