(T2108 measures the percentage of stocks trading above their respective 40-day moving averages [DMAs]. It helps to identify extremes in market sentiment that are highly likely to reverse. To learn more about it, see my T2108 Resource Page. You can follow real-time T2108 commentary on twitter using the #T2108 hashtag. T2108-related trades and other trades are posted on twitter using the #120trade hashtag)
T2108 Status: 63.7
VIX Status: 12.4
General (Short-term) Trading Call: See below
Reference Charts (click for view of last 6 months from Stockcharts.com):
S&P 500 or SPY
SDS (ProShares UltraShort S&P500)
U.S. Dollar Index (volatility index)
VIX (volatility index)
VXX (iPath S&P 500 VIX Short-Term Futures ETN)
EWG (iShares MSCI Germany Index Fund)
CAT (Caterpillar)
Commentary
The good news is that I sold my SSO calls for a nice double. The “bad news” is that I sold them BEFORE today’s 1.2% surge on the S&P 500 (SPY) to fresh all-time highs, missing another doubling in value. Such is the life of short-term trading.
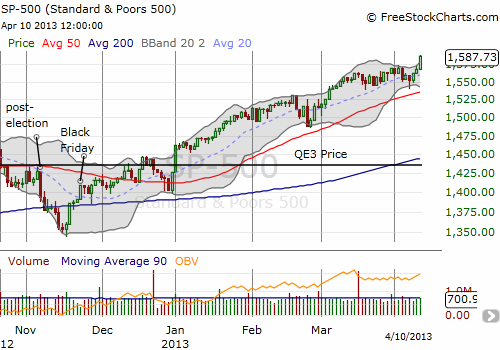
T2108 surged along with the S&P 500 to 63.7%. In just one week, T2108 has jumped from multi-month lows to a 1-month high. Momentum clearly favors the bullish. This also launches a fresh “over period” with T2108 crossing the 60% threshold. This event is now my first opportunity to analyze a combination of over periods. This is day #3 above the 50% threshold and day #1 above the 60%. There are several reasons to believe this is a critical moment where either the S&P 500 will now experience a quick correction – likely to the bottom of the Bollinger Band (BB) – OR experience a month-long rally.
Let’s walk through the case step-by-step using the T2108 Model as supporting evidence.
First, recent history on the S&P 500 shows that after the index tags or trades through the upper-BB, it experiences binary outcomes. The index either corrects quickly toward the lower-BB, OR the momentum continues for several weeks. Here is a list by date of tagging the upper-BB:
- Feb 3, 2012: Rally continues very slowly before correcting for three days starting March 3, 2012.
- March 13, 2012: Rally continues for a week before correcting. Market topped out thereafter before the May swoon.
- May 1, 2012: Sharp sell-off begins the next three days. Bottom not reached for another month.
- June 19, 2012: Sharp correction past 20DMA before rally continued.
- July 27, 2012: Sharp correction to the 20DMA before rally continued.
- Sept 6 THROUGH Sept 14, 2012: Pre and post-QE3 related euphoria. Gradual correction to 20DMA before rally continued. A retest of highs ended rally.
- Dec 8, 2012: Sharp correction to lower-BB
- Jan 2 to 4, 2013: Rally continued until next tag of upper-BB on Feb 19th
- Feb 19, 2013: Sharp correction to lower-BB
- Mar 5 to 11, 2013: Mostly sideways action until lower-BB “caught up” to churn, creating minor BB squeeze and preceding current 3-day bounce. It was this tag of the lower-BB that motivated me to buy SSO calls in anticipation of a rally similar to previous tags of the lower-BB.
With the market maintaining a bullish bias, the tendency is for the market to rally. So the truly exceptional event is when the S&P 500 corrects sharply following a tag of the upper-BB. Note above how the majority of upper-BB tags result in corrections. Think of the upper-BB tag as a “quasi-overbought” condition. Such corrections are buying opportunities right now until further notice. If the rally does continue without a correction, then it should have enough momentum to carry through the rest of the month, similar to the tags in January and March.
The T2108 model provides additional guidance. The chart below shows the average and median durations for T2108 to remain above certain thresholds.
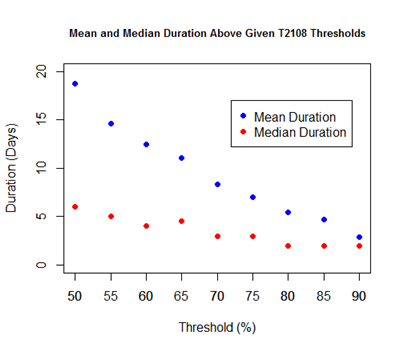
Note the consistent median around 5 days for the current 50 to 60% over periods. The mean, or average, duration drops quickly. We can now expect T2108 to levitate above 60% for about 12 days. During that time, the bias for S&P 500 performance moves upward from slightly negative to positive. Go beyond that, and expectations for S&P 500 performance increase relatively rapidly. In other words, the binary scenario for what to expect after today’s tag of the upper-BB roughly corresponds to the predicted S&P 500 performance shown by the charts below.
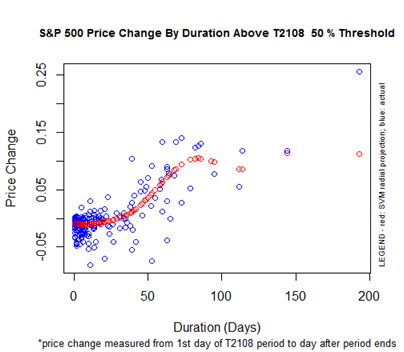
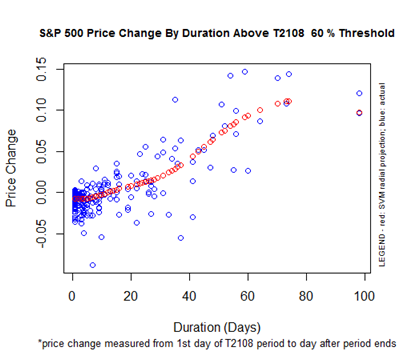
So, how to trade? IF the S&P 500 fails to follow-through tomorrow, I will buy SSO puts toward the close. If there is follow-through, I will buy SSO calls on the first dip off the upper-BB with the intention to hold as long as it seems to make sense.
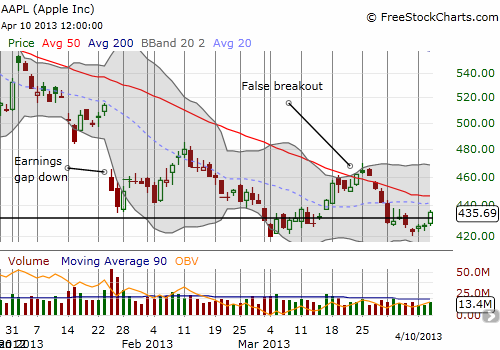
Finally, one encouraging sign…Apple (AAPL) bothered to join the fun today. The stock increased 2.0% and is trading above the previous critical support line. Unfortunately, AAPL tends to end weeks poorly, so I am expecting immediate pullback. If last Friday’s low can hold (looks like a hammer candlestick pattern but volume was unimpressive, hard to call it a strong bottoming pattern), then this pullback should be a good opportunity to play the likely bounce back to start the next week.
Daily T2108 vs the S&P 500

Black line: T2108 (measured on the right); Green line: S&P 500 (for comparative purposes)
Red line: T2108 Overbought (70%); Blue line: T2108 Oversold (20%)
Weekly T2108

*All charts created using freestockcharts.com unless otherwise stated
Related links:
The T2108 Resource Page
Expanded daily chart of T2108 versus the S&P 500
Expanded weekly chart of T2108
Be careful out there!
Full disclosure: long VXX shares and puts; long AAPL shares and puts
