(T2108 measures the percentage of stocks trading above their respective 40-day moving averages [DMAs]. It helps to identify extremes in market sentiment that are highly likely to reverse. To learn more about it, see my T2108 Resource Page. You can follow real-time T2108 commentary on twitter using the #T2108 hashtag. T2108-related trades and other trades are posted on twitter using the #120trade hashtag)
T2108 Status: 77.4% (first overbought day)
VIX Status: 14.7 (18.5% plunge!)
General (Short-term) Trading Call: Initiate SMALL short positions
Reference Charts (click for view of last 6 months from Stockcharts.com):
S&P 500 or SPY
SDS (ProShares UltraShort S&P500)
U.S. Dollar Index (volatility index)
VIX (volatility index)
VXX (iPath S&P 500 VIX Short-Term Futures ETN)
EWG (iShares MSCI Germany Index Fund)
CAT (Caterpillar)
Commentary
“Start bracing yourselves for a wild beginning of the new year…”
That was how I ended my last T2108 Update for the second to last trading day of 2012. It seems like an obvious statement as the countdown drew to a close on the Fiscal Cliff negotiations, yet I did not even have in mind the kind of two days that followed.
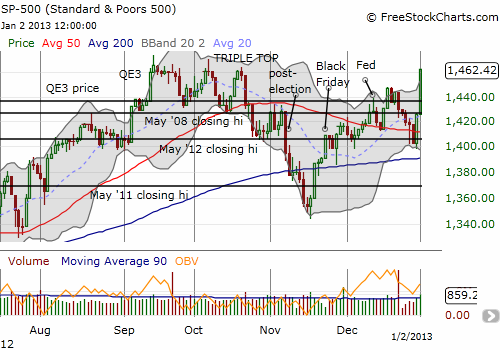
I will start by saying that if I had envisioned a perfect scenario for shorting the market, it would involve the S&P 500 driving into overbought territory just as it hit resistance from the triple top from September and October. I would next want a quick fade to confirm resistance. 2013 started with two of the three, so my trading call to initiate a SMALL short is necessarily cautious. Let’s review the details…
2012 ended with T2108 popping from 52.0% to 64.3%, an amazing 24% gain. This confirmed the bullish tone from the S&P 500’s 1.7% gain on the day that eliminated a (false) breakdown below the 50DMA. The S&P 500 ended the year exactly at the May, 2008 closing high. Further confirming the bullish turn was the sharp reversal of the VIX to close where it started a week prior. It was an eye-popping 21% deflation in the volatility index. The market was anticipating good news on the Fiscal Cliff negotiations, and it got it (more or less).
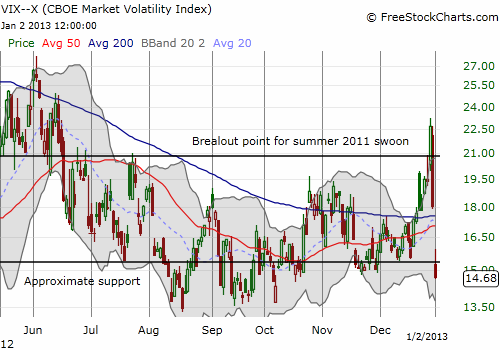
The follow-through to start 2013 was just as impressive as the close of 2012. T2108 jumped to 77.4%, completing an incredible 2-day 49% surge (data to come in a future post). I do not think I have ever seen anything quite like this. I am also sure I have not seen an overbought period start so extreme – I consider 80% an extreme overbought reading for T2108. When 2012 began with a one-day 1.5% rally, the first trading day delivered a marginally overbought reading of 70%. 2013 begins with the S&P 500 rallying 2.5%, one of the best starts to a year since 1950. The VIX was further crushed into powder and now sits at a lowly 14.7: the market transitioned from tense jitters to a tremendous sigh of relief in a 2-day flash. Note however that in recent history the VIX does not spend much time below 15; roughly one month seems to be the maximum. In other words, while all looks good now, the market should easily find something else to anguish about within just a few weeks.
The charts below put pictures to words on the current rally:
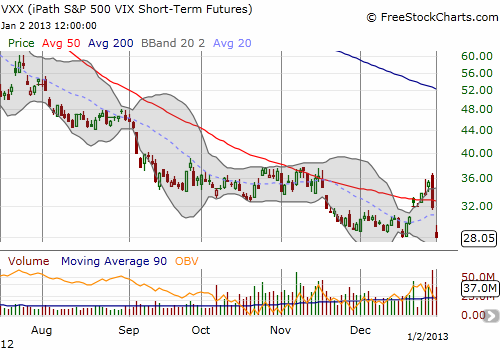
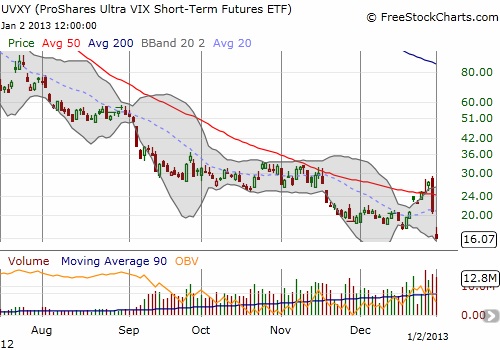
In the last T2108 Update, I noted how both the iPath S&P 500 VIX ST Futures ETN (VXX) and the ProShares Ultra VIX Short-Term Fut ETF (UVXY) have been poor choices for hedging Fiscal Cliff drama (or profiting from it). The collapse of both products back to all-time lows simply puts an exclamation point on their devious habits of ushering losses to all but the best market-timers. I was positioned with VXX shares and puts: while VXX dropped 12% today, the puts soared 138%. Looking back, I am realizing I did not add enough extra puts given the potential for such a large move (I ended up with a delta neutral position that will now gain quickly if VXX continues to decline from here).
The trading implications for these dramatic events are complicated. Honestly, my head was spinning when I sat down at the computer Wednesday night to catch up on the last two days of trading. The T2108 playbook dictates opening a short position here. My only hesitation is that the current rally has been so strong and so swift. Moreover, 2012 started overbought and stayed that way for one of the longest runs on record. Surely, 2013’s strong start suggests more of the same could be in store. However, the VIX could hold the key difference. 2011 ended with the VIX at 23.4. It took almost 2 1/2 months for the VIX to work its way down to 15.0 at which point the rally in the S&P 500 stalled almost like clockwork. In fact, it took QE3 in September to finally get the S&P 500 to fresh highs on the year. In between was a huge sell-off in May. 2012 ended with the VIX at 18.02 and it is now UNDER 15. The rally in the S&P 500 is starting from a much more “complacent” launching pad. It will likely need to feed on a steady diet of better and better news to sustain itself.
So, the best risk/reward move for now seems to be starting with a small number of SSO puts (or small amount of SDS shares). Such a trade will need to end if the S&P 500 closes at new multi-year highs and then follows through. At that point, the resistance from the triple top will be broken, setting the stage for a very bullish tone for the market. In the meantime, I sold all my SSO calls into Wednesday’s rally. These calls were part of putting my money where my mouth was regarding my optimism that Democrats and Republicans would somehow figure out a way to avert the Fiscal Cliff. I am not contemplating a scenario (yet) where I chase the market higher.
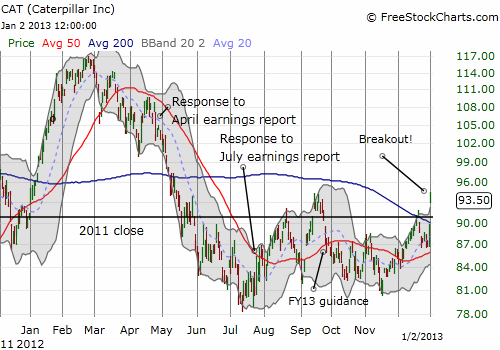
There are three other developments I want to add to the intrigue. First, Caterpillar (CAT) has finally broken out above its 200DMA resistance. While CAT faded back to the top of its near 8-month consolidation range, I consider this move to be very bullish. Follow-through will confirm the bullish move and will make me even more hesitant about shorting the market here. As a reminder, I consider CAT to be a “canary in the coalmine” for the market’s health. CAT remains well off its 2012 and all-time highs, but I think it is important to note that it never broke down when the S&P 500 sold off in November.
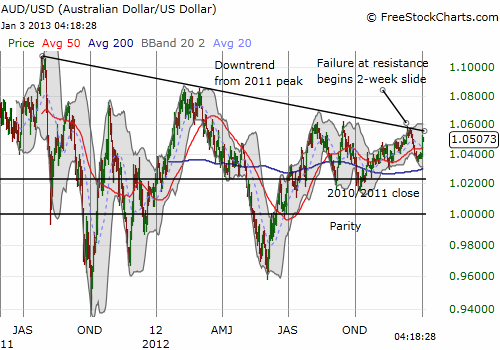
Second, the Australian dollar finally woke from its two-week slumber that started after it failed at resistance from its downtrend against the U.S. dollar. Its surge against ALL major currencies serves as confirming signal for the S&P 500. This correlation broke down at times over the past several months, but I think it will pay to continue monitoring the relationship. For now, I remain short AUD/USD, but I will drop the bearish position if the currency pair breaks out from its downtrend (I still cannot get bullish knowing that the Reserve Bank of Australia seems intent on driving interest rates lower until currency markets finally oblige in taking the currency lower).
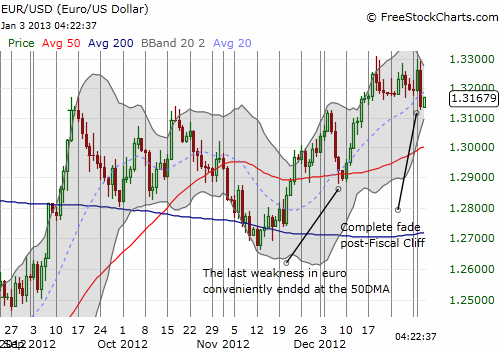
For comparison, the euro lost its post-Fiscal Cliff rally in about 12 hours. By the close of U.S. trading the euro was back at 2-week lows and immediately sold off further as the Asian trading session began.
Third, and finally, the bullish Black Friday trade remains intact. This post-Black Friday period is in about the 85th percentile in duration. The odds are now roughly 50/50 that the Black Friday trade will remain bullish over the next month or so. If the S&P 500 survives that period intact, then the odds become extremely good for a very bullish 2013 and beyond.
All things considered, there is simply no case here to get aggressively bearish although the immediate risk/reward favors a small bearish position for the T2108 trade. If you feel uncomfortable with this kind of uncertainty, get used to it. Screaming headlines from the latest government actions and/or declarations are sure to continue driving the market sharply and violently this year.
Daily T2108 vs the S&P 500

Black line: T2108 (measured on the right); Green line: S&P 500 (for comparative purposes)
Weekly T2108

*All charts created using freestockcharts.com unless otherwise stated
Related links:
The T2108 Resource Page
Expanded daily chart of T2108 versus the S&P 500
Expanded weekly chart of T2108
Be careful out there!
Full disclosure: long VXX shares and puts; long CAT; short AUD/USD
