(T2108 measures the percentage of stocks trading above their respective 40-day moving averages [DMAs]. It helps to identify extremes in market sentiment that are highly likely to reverse. To learn more about it, see my T2108 Resource Page. You can follow real-time T2108 commentary on twitter using the #T2108 hashtag. T2108-related trades and other trades are posted on twitter using the #120trade hashtag)
T2108 Status: 52.0%
VIX Status: 22.7 (16.7% gain!)
General (Short-term) Trading Call: Hold
Reference Charts (click for view of last 6 months from Stockcharts.com):
S&P 500 or SPY
SDS (ProShares UltraShort S&P500)
U.S. Dollar Index (volatility index)
VIX (volatility index)
VXX (iPath S&P 500 VIX Short-Term Futures ETN)
EWG (iShares MSCI Germany Index Fund)
CAT (Caterpillar)
Commentary
So much for the volatility index (VIX) getting stopped at resistance. After fading at the 21 resistance level on Thursday when good Fiscal Cliff news hit the wires, the markets were treated to the exact opposite on Friday. Bad Fiscal Cliff news hit the wires, and in the last 20 minutes of trade a mad scramble ensued. The VIX surged through resistance, and the S&P 500 tumbled back to the lows from Thursday. The daily charts now show clear and present danger. The VIX is showing rapidly growing (short-term) fear, and the S&P 500 closed firmly, well below its 50DMA.
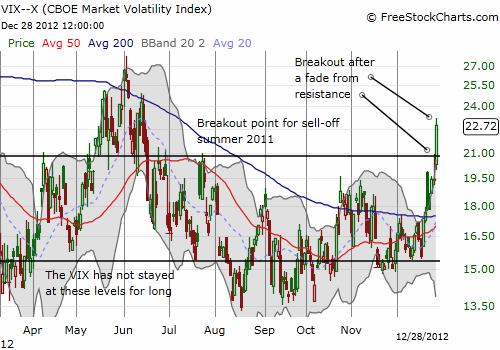
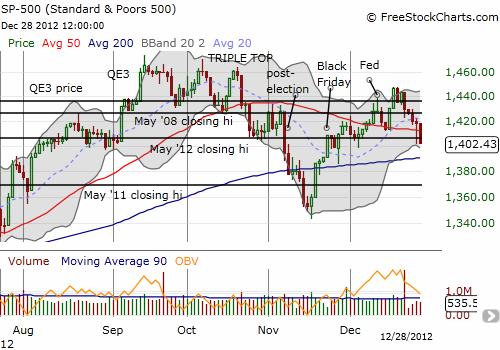
This is all a recipe to rush for shorts and puts, yet everything still hinges on headlines and political action. The S&P 500 has not even broken through its 200DMA yet. At 52%, T2108 is nowhere close to oversold, but given the growing tension shown in the charts above, T2108 could easily plunge to oversold territory in just a few days. At that time, I will feel more confident about executing fresh trades, contrarian of course. It could represent a repeat of the opportunity in November when a false breakdown below the 200DMA eventually coincided with oversold conditions. This BIG difference this time is that the VIX is actually on the move upward. In mid-November, the VIX was essentially on the sidelines, a guilty bystander to the selling action.
In the meantime, I am keeping my eye on a few volatility products. Although the VIX soared 16%, the iPath S&P 500 VIX ST Futures ETN (VXX) only increased 5.1%, and the ProShares Ultra VIX Short-Term Fut ETF (UVXY) increased 10.0%. The weekly charts below show some interesting patterns. VXX is only returning to levels last seen in late October and early November when a fresh surge in volume first began, presumably from folks betting on a bad post-election/Fiscal Cliff outcome. With the S&P 500 down since then, they would have been better off just directly shorting the index…so far. Having said that, last year’s surge in volume on VXX, preceded a nearly doubling in value. I remain positioned for a big move either way: VXX shares and puts. UVXY is a “new kid on the block.” Interest in this leveraged bet on the volatility index first hit the radar in early to mid-September. Volume has been relatively steady since then. Similar to VXX, most recent buyers in UVXY are at best back to even.
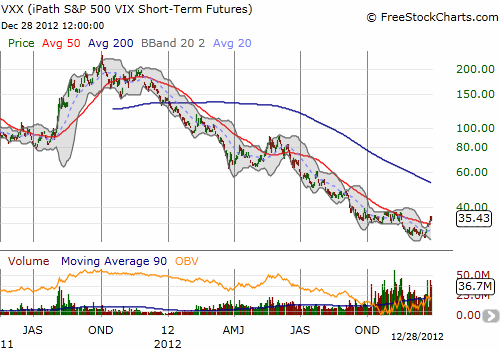
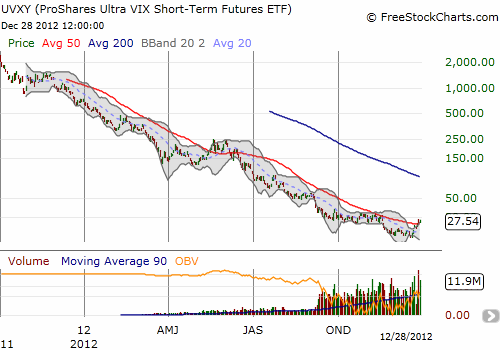
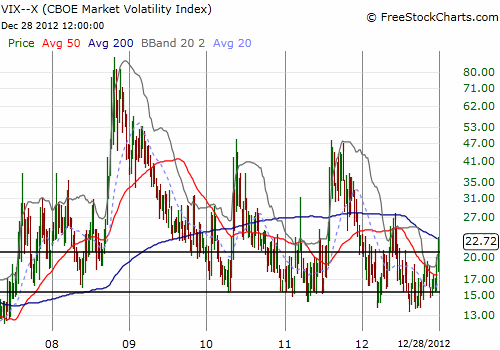
I show these charts as a reminder that playing the volatility products is all about your ability to nail precise timing. Whatever run these products get will be temporary, so you also cannot stick around long, much less use them as an on-going hedge. To make the point clear, here is a weekly chart of the VIX. Note the episodic spikes and the tendency to find (an unstable) equilibrium somewhere between 15 and 21. Perhaps even more importantly is the pattern of the VIX spending very little time at the 15 level. In other words, spikes are as inevitable as their ephemeral nature is inevitable.
Start bracing yourselves for a wild beginning of the new year…
Daily T2108 vs the S&P 500

Black line: T2108 (measured on the right); Green line: S&P 500 (for comparative purposes)
Weekly T2108

*All charts created using freestockcharts.com unless otherwise stated
Related links:
The T2108 Resource Page
Expanded daily chart of T2108 versus the S&P 500
Expanded weekly chart of T2108
Be careful out there!
Full disclosure: long VXX shares and puts; long SSO calls
