(T2108 measures the percentage of stocks trading above their respective 40-day moving averages [DMAs]. It helps to identify extremes in market sentiment that are highly likely to reverse. To learn more about it, see my T2108 Resource Page. You can follow real-time T2108 commentary on twitter using the #T2108 hashtag. T2108-related trades and other trades are posted on twitter using the #120trade hashtag)
T2108 Status: 68.1%
VIX Status: 18.0
General (Short-term) Trading Call: Hold (assuming at least a small bearish position is in hand).
Reference Charts (click for view of last 6 months from Stockcharts.com):
S&P 500 or SPY
SDS (ProShares UltraShort S&P500)
U.S. Dollar Index (volatility index)
VIX (volatility index)
VXX (iPath S&P 500 VIX Short-Term Futures ETN)
EWG (iShares MSCI Germany Index Fund)
CAT (Caterpillar)
Commentary
The Australian dollar (FXA) sold off against the U.S. dollar and provided the signal for a poor start on the S&P 500. It looked like a clear follow-through day of selling as the S&P 500 dropped to fresh multi-week lows, and I tweeted my assessment. However, the market had other plans and began a sharp comeback that was NOT supported by an equally sharp comeback for the Australian dollar until late. The Australian dollar closed the U.S. trading session weakly and formed a mildly bearish divergence (that is, do not believe the S&P 500’s strong close). The overall pattern produced a stalemate with the S&P 500 closed essentially even with Friday’s stalemate day.
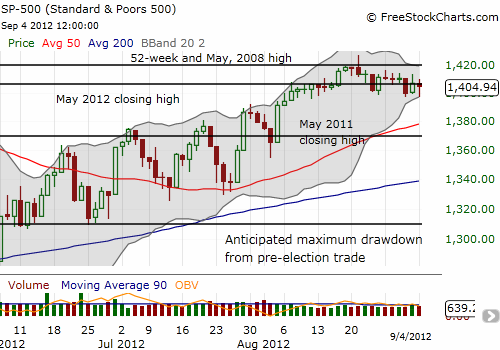
Note that the downtrend from August’s topping pattern continues, and the index is stalling at resistance from the May, 2012 closing high. However, while the bulls have a lot to prove given overhead resistance, the bears have yet to prove they can really nail the market to weak closes; buyers keep muscling their way in for the day’s “bargains.”
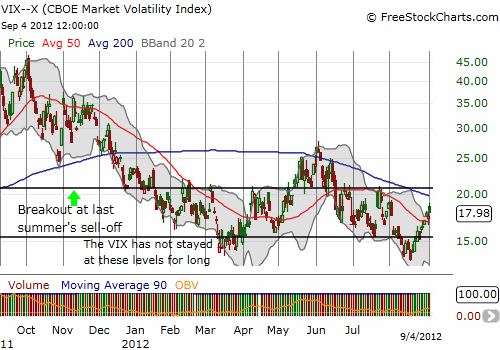
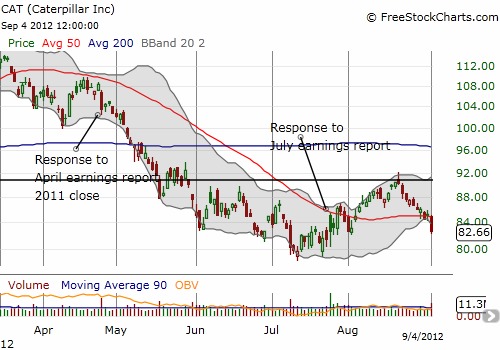
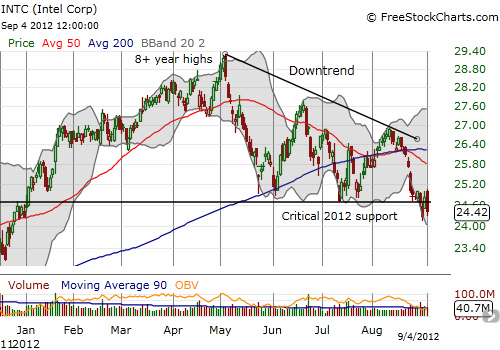
The latest bearish divergence between the Australian dollar and the S&P 500 is not the only looming warning signal. I have three others that caught my attention today that I think are significant and outweigh other positives:
- The volatility index, the VIX, continues to rally in a straight line off recent lows.
- Caterpillar (CAT), my favorite canary in the coal mine broken down below its 50DMA again. It remains negative for the year. This latest breakdown came on high volume. Anecdotally, I think stocks tend to stay weak for some time after this kind of move.
- Intel (INTC), another important cyclical, broke down again below critical 2012 support. It is almost flat for the year. With 50 and 200DMA resistance looming overhead, INTC looks like it is headed lower.
Here are the graphs that tell the story:
While it is easy to pick on these red flags, I would be remiss if I did not pull up a chart of Apple (AAPL). It had a very strong close that provides a very bullish follow-up to Friday’s “hammer” pattern. Apple looks like it could easily set new all-time highs by the end of this week as the recent strong uptrend continues.
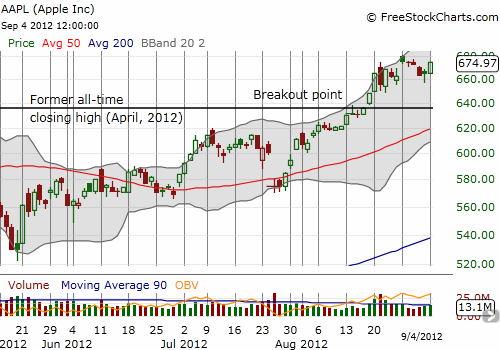
Overall, I remain bearish for the short-term and still expect a sell-off in the S&P 500 to at least the 50DMA. Strong stocks like AAPL seem not likely to follow the market downward, at least for now!
Daily T2108 vs the S&P 500
Click chart for extended view with S&P 500 fully scaled vertically (updated at least once a week)

Black line: T2108 (measured on the right); Green line: S&P 500 (for comparative purposes)
Weekly T2108

*All charts created using freestockcharts.com unless otherwise stated
Related links:
The T2108 Resource Page
Expanded daily chart of T2108 versus the S&P 500
Expanded weekly chart of T2108
Be careful out there!
Full disclosure: long SSO puts; long VXX shares and puts, short VXX calls, long CAT, net short Australian dollar, long AAPL calls
