(T2108 measures the percentage of stocks trading above their respective 40-day moving averages [DMAs]. It helps to identify extremes in market sentiment that are highly likely to reverse. To learn more about it, see my T2108 Resource Page. You can follow real-time T2108 commentary on twitter using the #T2108 hashtag. T2108-related trades and other trades are posted on twitter using the #120trade hashtag)
T2108 Status: 67.6%
VIX Status: 17.5
General (Short-term) Trading Call: Hold.
Reference Charts (click for view of last 6 months from Stockcharts.com):
S&P 500 or SPY
SDS (ProShares UltraShort S&P500)
U.S. Dollar Index (volatility index)
VIX (volatility index)
VXX (iPath S&P 500 VIX Short-Term Futures ETN)
EWG (iShares MSCI Germany Index Fund)
CAT (Caterpillar)
Commentary
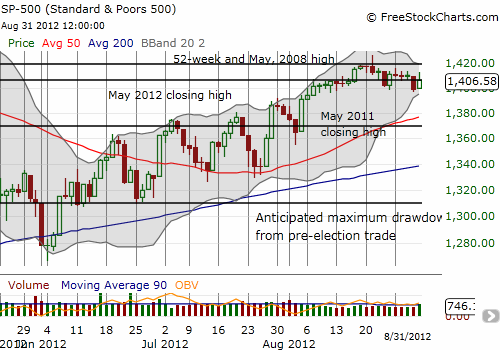
Jackson Hole caused a lot of intraday trading excitement, but the S&P 500 ended the day in a stalemate as T2108 barely budged. The S&P 500 jumped all over the place as Pavlovian market participants clearly tried to set records for speed-reading and interpretation of long speeches, but in the end, the index closed right on top of resistance.

Note the subtle downtrend in the S&P 500 from the August 21 top.
With T2108 continuing to hover directly below overbought territory, it cannot provide directional guidance. However, it still makes sense to maintain a bearish bias given the clear stop available at a new 52-week CLOSE. Follow-through from such a close will invalidate the topping pattern from August 21.
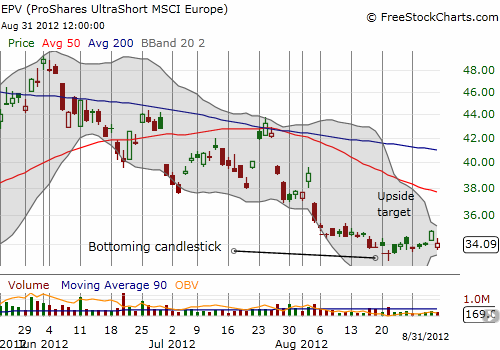
The most disappointing move on the day for me was the immediate washout of my gains on ProShares UltraShort MSCI Europe (EPV). EPV gapped down at the open although a subsequent intraday rally brought the ETF even with the previous day’s lows. If September were not the official launch of a seasonably weak period for stocks, I would have licked my wounds, closed out the trade, and thanked the trading Gods for letting me exit at breakeven. Instead, I will tempt fate and remain firm unless EPV closes at a new all-time low.

I was also disappointed to see that I sold my TLT calls early. That disappointment was partially compensated by the tremendous rally in gold and silver. (See “Chart Review: Gold Finally Breaks Out, TLT Cracks Resistance“). I have maintained my stubborn bullishness on both and continue to believe that patience will pay off handsomely.
Daily T2108 vs the S&P 500
Click chart for extended view with S&P 500 fully scaled vertically (updated at least once a week)

Black line: T2108 (measured on the right); Green line: S&P 500 (for comparative purposes)
Weekly T2108

*All charts created using freestockcharts.com unless otherwise stated
Related links:
The T2108 Resource Page
Expanded daily chart of T2108 versus the S&P 500
Expanded weekly chart of T2108
Be careful out there!
Full disclosure: long SSO puts; long EPV, GLD, and SLV
