(T2108 measures the percentage of stocks trading above their respective 40-day moving averages [DMAs]. It helps to identify extremes in market sentiment that are highly likely to reverse. To learn more about it, see my T2108 Resource Page. You can follow real-time T2108 commentary on twitter using the #T2108 hashtag. T2108-related trades and other trades are posted on twitter using the #120trade hashtag)
T2108 Status: 74.3% (overbought day #1)
VIX Status: 15.6
General (Short-term) Trading Call: Hold (after S&P 500 follows through, reduce bearish holdings, buy on dips).
Reference Charts (click for view of last 6 months from Stockcharts.com):
S&P 500 or SPY
SDS (ProShares UltraShort S&P500)
U.S. Dollar Index (volatility index)
VIX (volatility index)
VXX (iPath S&P 500 VIX Short-Term Futures ETN)
EWG (iShares MSCI Germany Index Fund)
CAT (Caterpillar)
Commentary
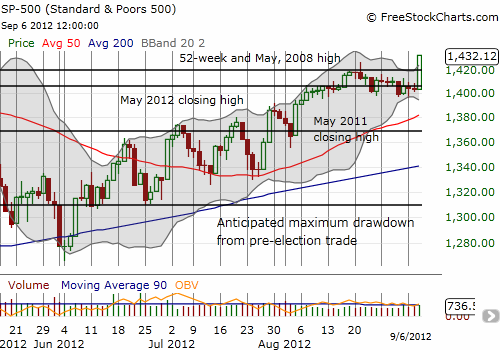
It seems that when the market swipes away the hard work of several weeks or months, it is downside action erasing a long, tortuous rally. Today, the S&P 500 soared 2.0% to new 4-year highs, erasing two weeks of bearish action that had convinced me that a retest of the 50DMA was around the corner.

Today’s rally brushes away in a single, masterful swipe all the bearish undertones that were building in the trading action, including the topping pattern that started the mild sell-off. This is like an exclamation mark on the inability of sellers to really nail the S&P 500 to closing lows during most of this time where the index dribbled slowly downward. I did not envision a new high happening this way. I had assumed it would happen over the course of days of painstaking progress, even stopping right at the high for added tension.
I was caught particularly flat-footed because I have been in the middle of ramping up my research on economic conditions in Australia. I am trying to refocus on the commodity crash playbook which includes a strategy for buying commodities made cheap from a significant downturn in China’s economy. Australia is heavily dependent on Chinese consumption of their commodities, particularly iron ore. Iron ore prices have collapsed in recent weeks and many predict they will be going even lower as China continues to pump out more steel and build out more capacity into a saturated market. Almost everything I have read to-date suggests that Australia’s economy is slowly deteriorating and China is unlikely to avoid a significant decrease in its rate of growth. These data are not the material for concluding that the S&P 500 would soar 2% to reach a new 4-year high! (Silly fundamentals!)
Although T2108 has now entered overbought territory, this trading action must be respected. As I have indicated before, after the S&P 500 provides a confirming follow-through with a strong and higher close from today, my plan turns to becoming an aggressive buyer on dips. I am assuming this is the beginning of the long-awaited follow-through to the extended, overbought period that started the year. This is a strategy that worked well in March. This time, I am launching the overbought strategy right from the beginning. This will be a strange time for T2108 followers, especially since the “buy overbought” is a strategy that is in its infancy compared to other tried and true T2108 trading strategies. The current strategy ends the moment the S&P 500 closes BELOW today’s low.
The most painful loss on the day was ProShares UltraShort MSCI Europe (EPV). Given I thought a rally to new highs would unfold slowly, I figured I would have time to bail on a losing EPV trade. Instead, EPV gapped down, and in two blinks of the eye delivered a crushing 6.0% loss. The large irony here is that for the majority of time I held EPV, I was either flat or had a gain. I even sat on last Thursday’s nice pop because my eyes were trained on a retest of the 50DMA resistance. Now, I will most likely be incurring a large loss after EPV confirms this recent bout of weakness.
My Apple calls formed The most frustrating part of the day. They should have soared on a day like today, but Apple’s under-performance held price gains in check until the corrosive impact of time finally took a crushing toll on them. These calls are in place specifically to guard against any big surprise losses in bearish positions. I assumed Apple would rally as much and more on a day like today! While these calls have one more day to go, I am expecting to close them out at a loss.
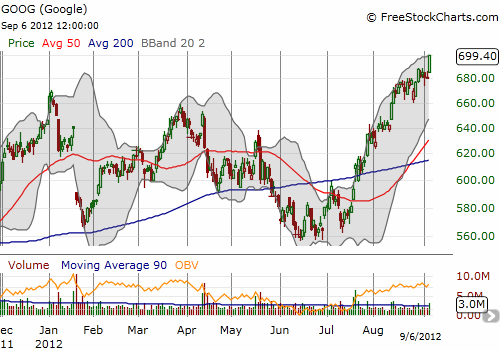
Google (GOOG) is an example of a stock that DID perform as expected on such a day. GOOG soared 2.7% to $699, new 52-week highs and closing in on new all-time highs. Holders of calls got a very nice payday today! (I will also soon close out of a small short position on GOOG that went from green to red in an instant today).

While I was able to close out some other long plays for a decent payoff, I mention these setbacks as a reminder that traders can never take anything for granted in the market. Bulls are in charge now, and bears are on the run (screaming bloody murder, like “but iron ore prices are collapsing!”). Brace yourselves: the world’s central banks are likely to see their opportunity here and press pedal to medal!
Daily T2108 vs the S&P 500
Click chart for extended view with S&P 500 fully scaled vertically (updated at least once a week)

Black line: T2108 (measured on the right); Green line: S&P 500 (for comparative purposes)
Weekly T2108

*All charts created using freestockcharts.com unless otherwise stated
Related links:
The T2108 Resource Page
Expanded daily chart of T2108 versus the S&P 500
Expanded weekly chart of T2108
Be careful out there!
Full disclosure: long SSO puts; long AAPL calls, short GOOG
