(T2108 measures the percentage of stocks trading above their respective 40-day moving averages [DMAs]. To learn more about it, see my T2108 Resource Page. You can follow real-time T2108 commentary on twitter using the #T2108 hashtag. T2108-related trades and other trades are posted on twitter using the #120trade hashtag)
T2108 Status: 67.2%
VIX Status: 15.2
General (Short-term) Trading Call: Lock in some profits on longs otherwise hold (assuming bearish positions already in place). Trading bias remains with the bears.
Reference Charts (click for view of last 6 months from Stockcharts.com):
S&P 500 or SPY
SDS (ProShares UltraShort S&P500)
U.S. Dollar Index (volatility index)
VIX (volatility index)
VXX (iPath S&P 500 VIX Short-Term Futures ETN)
EWG (iShares MSCI Germany Index Fund)
CAT (Caterpillar)
Commentary
The Federal Reserve minutes last week seemed to hike up the odds of another round of quantitative easing (QE3). It seems that those minutes have also re-sensitized the stock market to any mention of QE. In a Pavlovian response, the S&P 500 recovered from what looked like more follow-through to yesterday’s selling to a recovery of most those losses as QE3 excitement reignited. This time, it was apparently triggered by an article in the WSJ summarizing a letter Ben Bernanke wrote to defend the Fed’s actions that contained no new information.
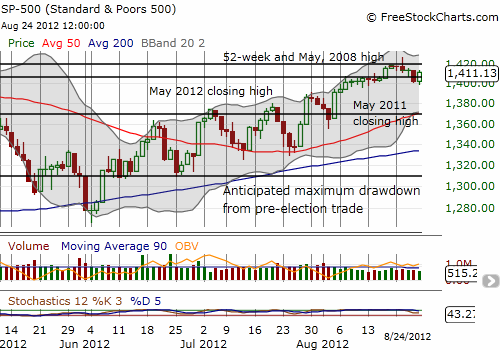
Anyway, the market’s response is what it is. Surprisingly, the strong charge did not return the market to overbought status. Regardless, I think this area is a fine point to initiate new/fresh shorts given the clear stop out point from the apparent market topping pattern. Whereas the bears had firm control last week, the Pavlovian jump on Friday indicates the sellers still do not have a firm grip on sentiment. All the buyers need now is more QE-constructive talk out of this week’s Jackson Hole confab to break the market to fresh 4+ year highs. As I have said before, once such a breakout gets confirmed with a higher close, it will be time to convert to an aggressive buy the dip strategy that includes intraday dips.
So, to be clear, here is a summary of my assumptions from the current technical “evidence”:
- For now, the bias remains bearish. Initiate new bearish positions but do not accumulate.
- Short-term downside risk is 1371 at the 50DMA (a 3% drop from current levels). This also happens to be support from the May, 2011 high.
- Intermediate downside risk is 1310 which is a 5% downdraft for the pre-election trade (featuring an incumbent President). This level just happens to be supported by the first dip after the June low.
- Aggressively bullish bias gets triggered by two “strong” closes at 1428 or higher.

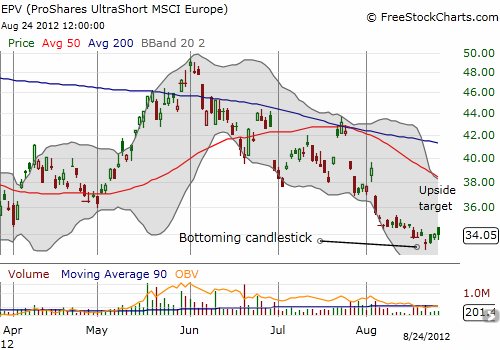
Finally, I ramped back into ProShares UltraShort MSCI Europe (EPV) with a second tranche bought into the dip from the QE-phoria. An easy stop is a fresh all-time low.

For a QE-like hedge, I purchased September calls on Caterpillar (CAT). CAT dipped the entire week back to support form the 15th. CAT now seems to be the perfect “catch-up” stock for buyers who want to bet on an economic recovery and/or the support of fresh money for the economy (which should mostly head for the stock market). CAT remains negative for the year and did not bottom until July. The 50DMA should provide support directly below current levels.
Daily T2108 vs the S&P 500
Click chart for extended view with S&P 500 fully scaled vertically (updated at least once a week)

Black line: T2108 (measured on the right); Green line: S&P 500 (for comparative purposes)
Weekly T2108

*All charts created using freestockcharts.com unless otherwise stated
Related links:
The T2108 Resource Page
Expanded daily chart of T2108 versus the S&P 500
Expanded weekly chart of T2108
Be careful out there!
Full disclosure: long SSO puts, CAT shares and calls, EPV
