
AT40 = 35.8% of stocks are trading above their respective 40-day moving averages (DMAs)
AT200 = 46.9% of stocks are trading above their respective 200DMAs
VIX = 11.4 (14.0% decrease)
Short-term Trading Call: neutral
Commentary
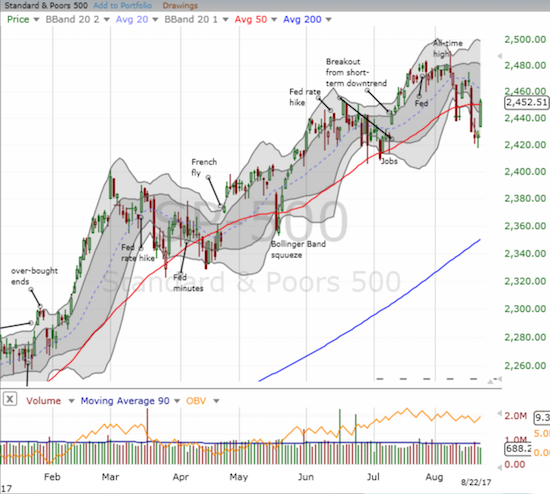
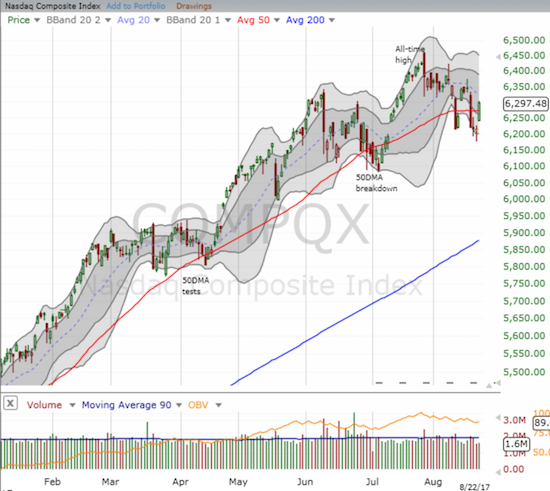
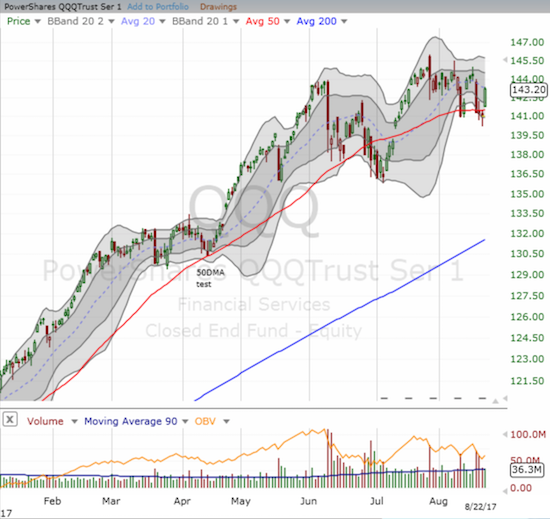
Since last Thursday when I lasted posted Above the 40, AT40 (T2108), the percentage of stocks trading above their respective 40-day moving averages (DMAs), increased 4 percentage points. AT200 (T2107), the percentage of stocks trading above their respective 200DMAs, is flat since then. T2107 takes some of the shine off the rebound from Thursday’s low that today sent the S&P 500 (SPY) closing above its 50DMA. The NASDAQ and the PowerShares QQQ ETF (QQQ) also closed above their respective 50DMAs. Note the the 20DMA for each index is in decline.
The big dramatic change occurred in volatility. As has been the case for a while, the last spike could only sustain flight for a few days before completely imploding. The volatility index (VIX) cratered from 15.6, just above the critical 15.35 pivot, to 11.4, hovering just above the level I consider to be “extremely low.”
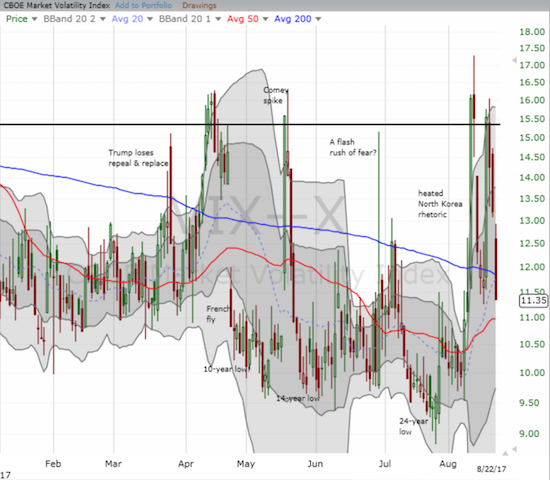
While I missed trading this latest volatility fade, I jumped at the opportunity to re-establish my standing call options in ProShares Ultra VIX Short-Term Futures ETF (UVXY). For good measure, I also bought puts on ProShares Short VIX Short-Term Futures ETF (SVXY). With the indices above their 50DMAs, I consider these positions to be hedges, not bearish bets. My short-term trading call stays at neutral until the S&P 500 closes above the topping pattern formed by last week’s selling. Unlike my last short-lived switch to bullishness, I am not rushing to get ahead of a reflex bounce from “close enough” oversold conditions (AT40 in the low 30s%).
There are two indices which make me think today was mostly about reflexive buying.
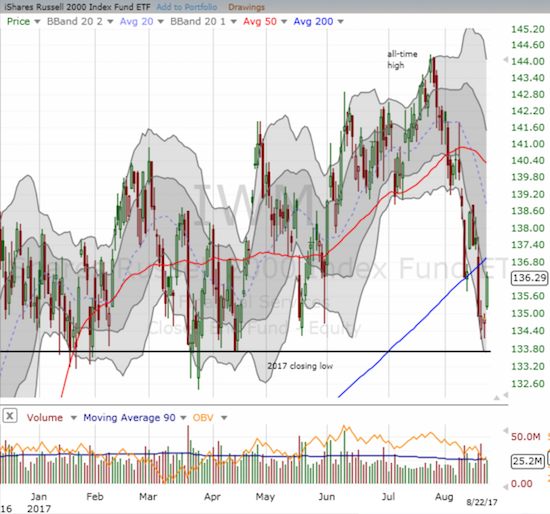
The iShares Russell 2000 ETF (IWM) came within a hair of 2017’s closing low and was in the red year-to-date. Today’s 1.1% bounce makes the index appear to have confirmed solid support despite last week’s 200DMA breakdown.
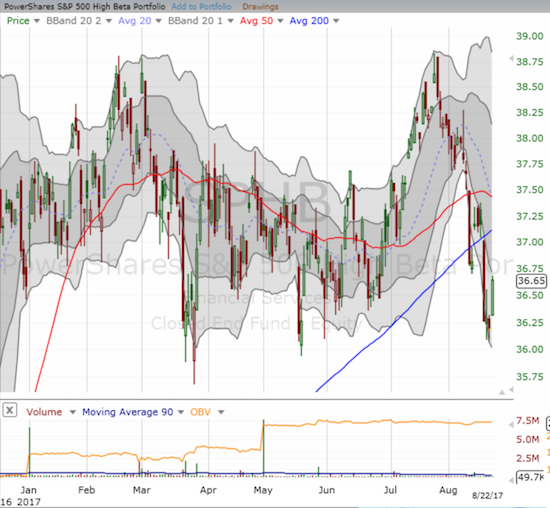
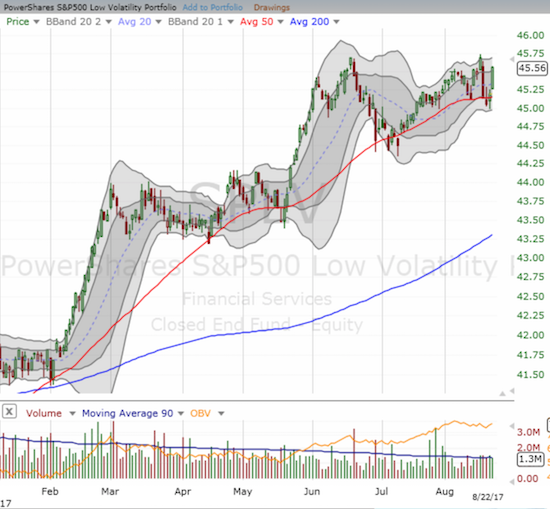
AT40 and AT200 suggest that a sizable number of stocks are lagging the major indices. The under-performing small caps are a part of that story. There are also a notable group of S&P 500 stocks that are heavy weights on the trading action: PowerShares S&P 500 High Beta ETF (SPHB). SPHB bounced off its lows of 2017 and barely crept back into the green for the year. I include the PowerShares S&P 500 Low Volatility ETF (SPLV) for comparison.
On this day of rebounds, I had a big whiff and a bunt single.
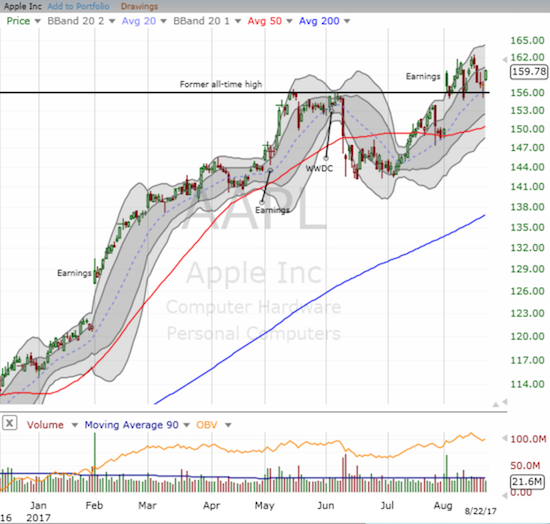
Apple (AAPL) rebounded nicely from its former all-time closing high set in May. On Monday, my lowball offer for call options was never filled, and I missed today’s 1.6% rebound. If AAPL delivers a dip on Wednesday, I will likely pay up for some call options in anticipation of a fresh challenge of the current all-time highs.
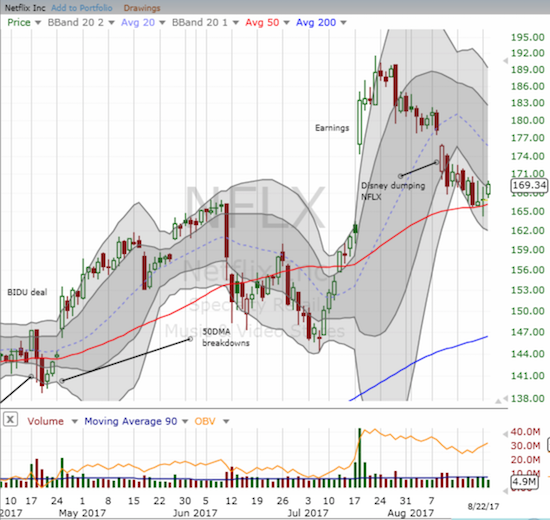
Netflix (NFLX) steadily dribbled downward after hitting a post-earnings and fresh all-time high in late July. After Disney (DIS) announced it will dump NFLX as a distribution platform, the NFLX sell-off kicked into a slightly more urgent gear. Yet, NFLX’s 50DMA was up to the task for providing support. I speculated on call options on yesterday’s test and promptly locked in profits today with NFLX on its way to a 1.6% gain.
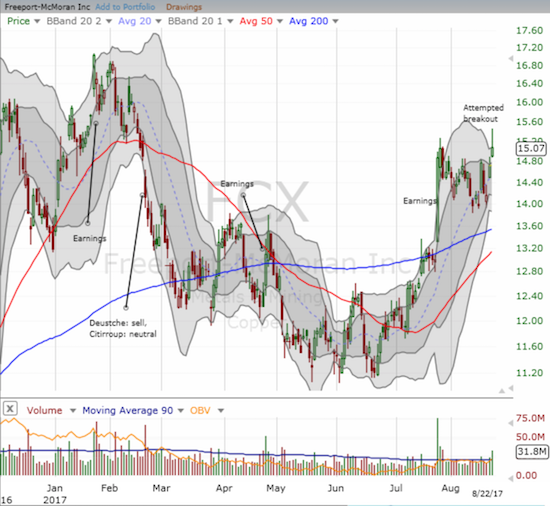
One of the big stories on the day was copper. Its price hit a 3-year high in a move that has to be interpreted as bullish for the global economy. While I am already long FCX, I am looking at adding call options to the mix to play what looks like an imminent breakout.
— – —
FOLLOW Dr. Duru’s commentary on financial markets via email, StockTwits, Twitter, and even Instagram!
“Above the 40” uses the percentage of stocks trading above their respective 40-day moving averages (DMAs) to assess the technical health of the stock market and to identify extremes in market sentiment that are likely to reverse. Abbreviated as AT40, Above the 40 is an alternative label for “T2108” which was created by Worden. Learn more about T2108 on my T2108 Resource Page. AT200, or T2107, measures the percentage of stocks trading above their respective 200DMAs.
Active AT40 (T2108) periods: Day #382 over 20%, Day #196 over 30%, Day #4 under 40% (underperiod), Day #13 under 50%, Day #19 under 60%, Day #142 under 70%
Daily AT40 (T2108)
")
Black line: AT40 (T2108) (% measured on the right)
Red line: Overbought threshold (70%); Blue line: Oversold threshold (20%)
Weekly AT40 (T2108)

*All charts created using freestockcharts.com unless otherwise stated
The charts above are my LATEST updates independent of the date of this given AT40 post. For my latest AT40 post click here.
Related links:
The T2108 Resource Page
You can follow real-time T2108 commentary on twitter using the #T2108 or #AT40 hashtags. T2108-related trades and other trades are occasionally posted on twitter using the #120trade hashtag.
Be careful out there!
Full disclosure: long FCX, long UVXY call options, long SVXY put options, log DIS call option
*Charting notes: FreeStockCharts.com uses midnight U.S. Eastern time as the close for currencies.