
(T2108 measures the percentage of stocks trading above their respective 40-day moving averages [DMAs]. It helps to identify extremes in market sentiment that are likely to reverse. To learn more about it, see my T2108 Resource Page. You can follow real-time T2108 commentary on twitter using the #T2108 hashtag. T2108-related trades and other trades are occasionally posted on twitter using the #120trade hashtag. T2107 measures the percentage of stocks trading above their respective 200DMAs)
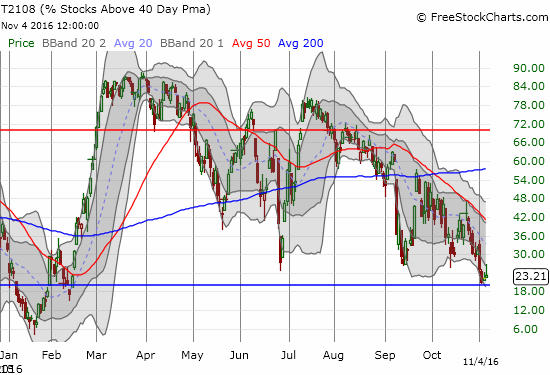
T2108 Status: 23.2%
T2107 Status: 48.6%
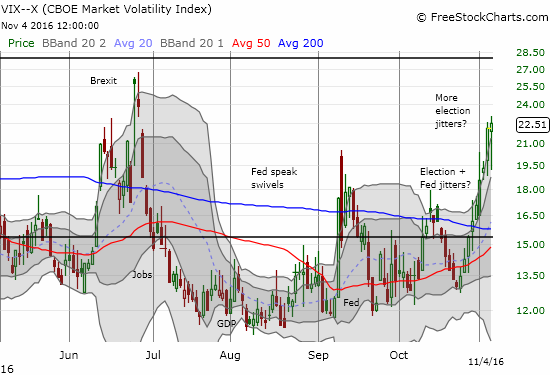
VIX Status: 22.5 (was as low as 19.2)
General (Short-term) Trading Call: cautiously bullish
Active T2108 periods: Day #180 over 20%, Day #6 under 30% (underperiod), Day #11 under 40%, Day #28 under 50%, Day #43 under 60%, Day #69 under 70%
Commentary
I am keeping this piece relatively short because apparently futures are soaring on more Clinton email news. I am assuming the stock market will get a strong open, but there is of course no guarantee on the sustainability of a strong open. However, based on two straight days of bullish divergence, I strongly suspect that bulls will keep up the pressure on Monday.
On Thursday, November 3, I finally shifted the short-term trading call to a bullish bias. I described how previous bearish divergences had resolved into noticeable selling along with the first, very slight, bullish divergence. The next day, another bullish divergence emerged even as the S&P 500 (SPY) faded hard into a historic 9th straight day of selling – such persistent selling has not happened since 1980. The good news is that the S&P 500 valiantly held on to support at its 200-day moving average (DMA).
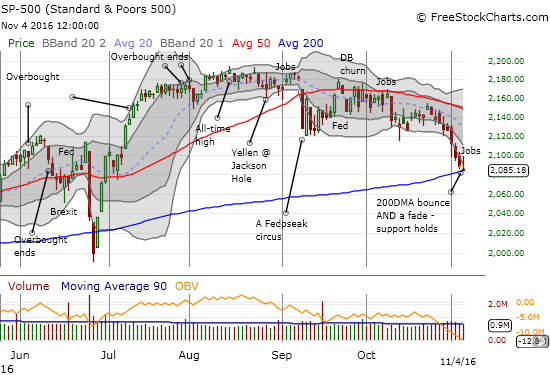
T2108, the percentage of stocks trading above their respective 40DMAs, faded along with the S&P 500. However, T2108’s surge on the day was so strong that my favorite technical indicator finished the day with a gain from 22.3% to 23.2%. The stock market looks like it is doing its best to stay out of oversold territory (below 20%).
The bullish divergence between T2108 and the S&P 500 will take on definitive importance if the stock market gaps up to start the week and holds that gap. At that point, I would drop the “cautiously” from my bullish trading bias…especially given the technicals will suggest a successful test of 200DMA support.
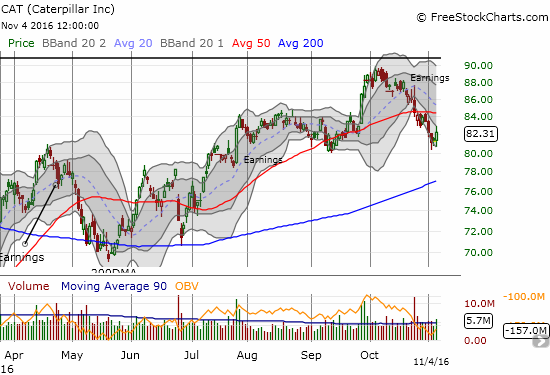
Catepillar (CAT) printed one of the strongest symbols of bullish divergence on Friday with a strong 1.3% gain. Trading volume was above average and CAT closed near its high for the day.
As the stock market rallied on Friday, the volatility index, the VIX dropped far enough to reverse all of Thursday’s gains. At the close, the VIX rallied for a positive gain and ended the week with a very wild swing.
I have two main trades of note.
I finally sold my shares of ProShares UltraShort S&P 500 (SDS) and locked in the profits. Per my trading rules for oversold conditions, now is the time to start earnestly closing out bearish positions. SDS was on the top of my list. Next on my trading list was Apple (AAPL).
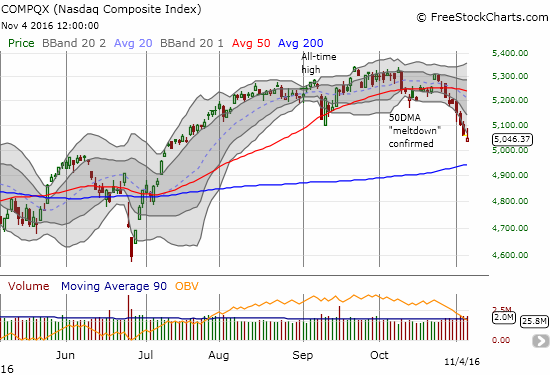
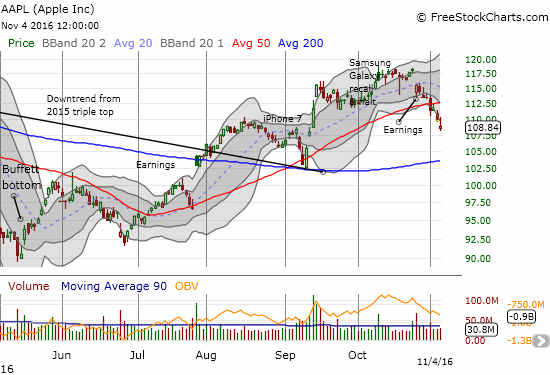
I have not covered AAPL since late September. I did not post a pre-earnings trading call. I did not even acknowledge the post-earnings gap down that appeared to etch a fresh top in AAPL and reversed all of its Samsung-related gains. AAPL broke through 50DMA support on high volume to start November trading. AAPL closed the week with a complete reversal of the gains from the iPhone 7 breakout. With a bullish trading bias in hand, I thought this was as good a time as any to get back to trading AAPL options. I am targeting a test of 50DMA resistance around $112.50.
— – —
FOLLOW Dr. Duru’s commentary on financial markets via email, StockTwits, Twitter, and even Instagram!
Daily T2108 vs the S&P 500
")
Black line: T2108 (measured on the right); Green line: S&P 500 (for comparative purposes)
Red line: T2108 Overbought (70%); Blue line: T2108 Oversold (20%)
Weekly T2108

*All charts created using freestockcharts.com unless otherwise stated
The charts above are the my LATEST updates independent of the date of this given T2108 post. For my latest T2108 post click here.
Related links:
The T2108 Resource Page
Be careful out there!
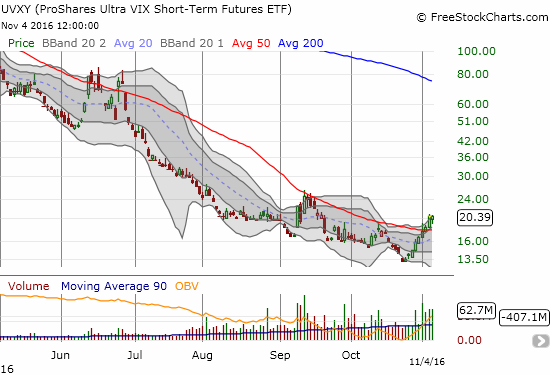
Full disclosure: long UVXY shares and short UVXY call and long UVXY put options, long AAPL call options, long CAT call options