
AT40 = 47.9% of stocks are trading above their respective 40-day moving averages (DMAs)
AT200 = 62.5% of stocks are trading above their respective 200DMAs
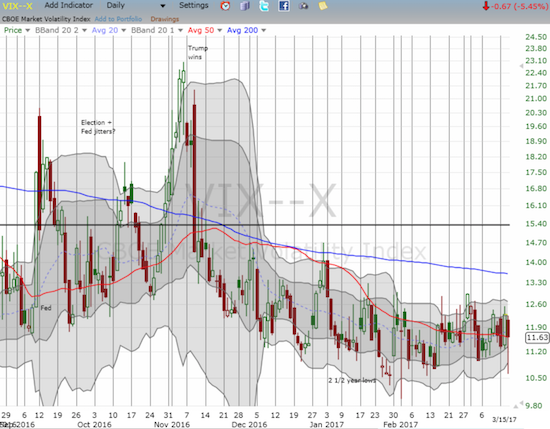
VIX = 11.6 (volatility index)
Short-term Trading Call: neutral
Commentary
The U.S. Federal Reserve hiked its interest rate as expected by 0.25%. The accompanying statement was remarkable only for being as bland as can be with nothing new to say. As usual, the Fed did not want to cause any surprises or any market angst.
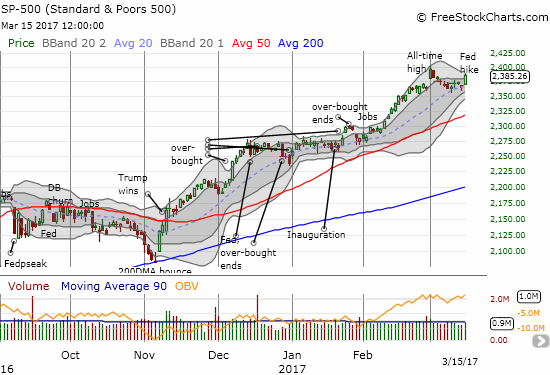
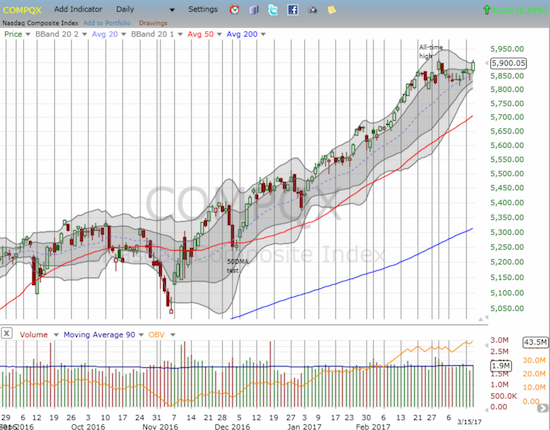
The market celebrated by sending the S&P 500 (SPY) higher by 0.8% in a move that was set up in near picture-perfect style with last Friday’s picturesque test of its uptrending support at its 20-day moving average (DMA). As I noted at that time, if not for the poor underlying technicals, I would have called the setup bullish. The NASDAQ (QQQ) popped 0.7% and closed just below its all-time high. The volatility index, the VIX, plunged as low as 10.6 before closing at 11.6. AT40 (T2108), the percentage of stocks trading above their respective 40DMAs, jumped from as low as 36.5% the previous day to a close of 47.9%. AT200 (T2107), the percentage of stocks trading above their respective 200DMAs, confirmed the bullish tone of the day by soaring from as low as 55.9% the previous day to a close of 62.5%.
Financials are supposed to be the core driver of the current market rally. Yet, the Financial Select Sector SPDR ETF (XLF) went absolutely nowhere as buyers and sellers fought a mini-battle around XLF’s 20DMA support.
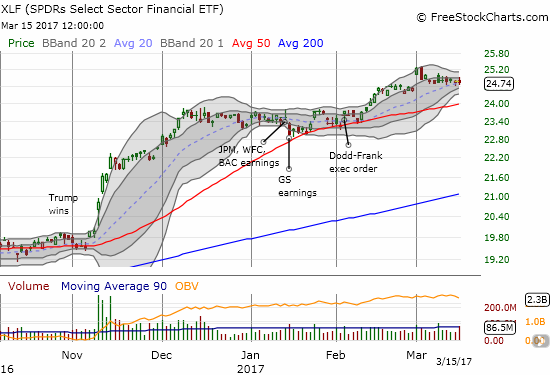
The lack of movement for XLF was surprising but consistent with the market’s apparent relief that the Federal Reserve’s schedule for rate hikes relaxed a bit. The financials are moving on rate expectations, and those expectations for the moment took a small step backward. Market expectations for the next rate hike dropped form June to July. The market’s odds for two rate hikes dropped slightly across each month. In other words, the market still expects two more rate hikes this year, but it effectively breathed a sigh of relief and relaxed a bit. The financial media I watched noted that the market “feared” the Fed might promote the notion of four total rate hikes for the year (that notion is effectively backing into an explanation for the market’s reaction since such fears were not reflected in the 30-day Fed Fund Futures).
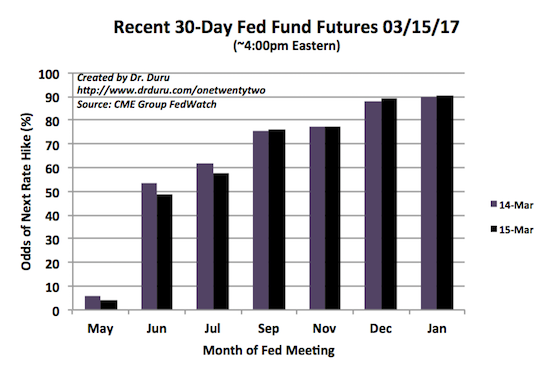
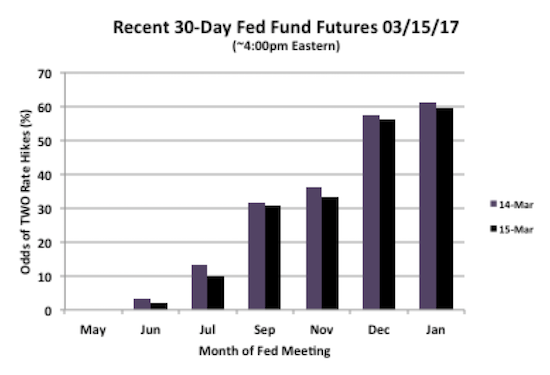
Source: CME FedWatch Tool
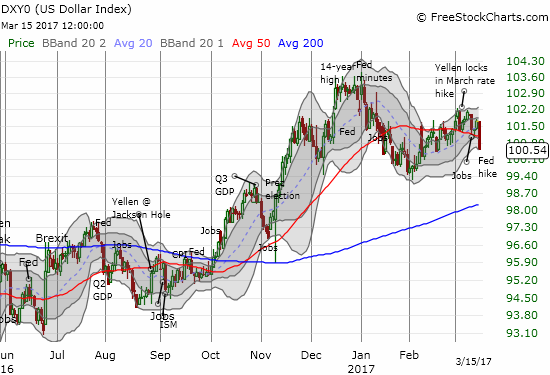
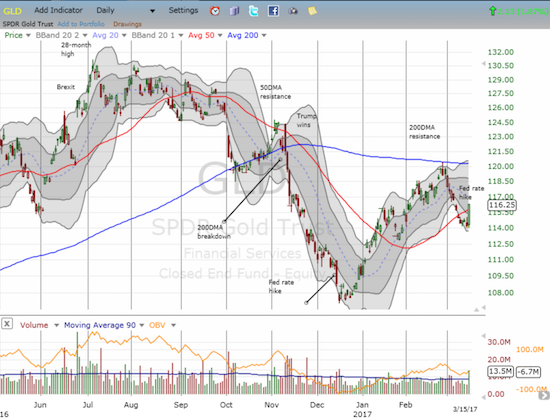
The sigh of rate relief can also be seen by the sharp selling in the U.S. dollar index (DXY0), the pop in the iShares 20+ Year Treasury Bond (TLT), and the sharp rally in the SPDR Gold Shares (GLD). For GLD in particular, note the sharp contrast with the Fed rate hike in December!
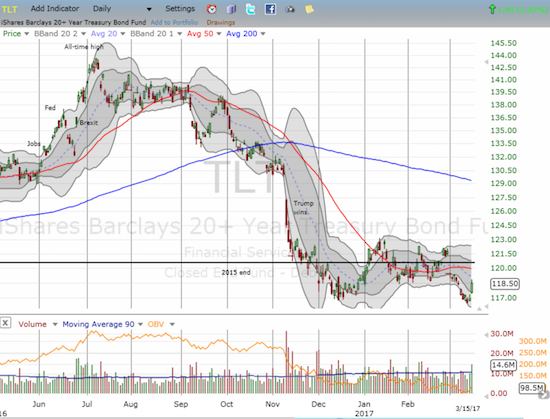
I used these moves to close out dollar short currency positions, add to my dollar long position, and buy back into TLT put options as part of my gold versus bonds pairs trade.
The market can now forget about the Fed and monetary policy for a while. The day’s rally further emphasized the bear/bull dividing line as a close below the last bullish breakout for the S&P 500. The shallow pullback managed to miss that line by the tiniest of margins. I have now moved that line slightly lower to be a close below the recent intraday low at 2354. My trading call remains as quiet as ever at neutral.
— – —
FOLLOW Dr. Duru’s commentary on financial markets via email, StockTwits, Twitter, and even Instagram!
“Above the 40” uses the percentage of stocks trading above their respective 40-day moving averages (DMAs) to assess the technical health of the stock market and to identify extremes in market sentiment that are likely to reverse. Abbreviated as AT40, Above the 40 is an alternative label for “T2108” which was created by Worden. Learn more about T2108 on my T2108 Resource Page. AT200, or T2107, measures the percentage of stocks trading above their respective 200DMAs.
Active AT40 (T2108) periods: Day #269 over 20%, Day #89 over 30%, Day #1 over 40% (overperiod ending 1 day under 40%), Day #7 under 50% (underperiod), Day #10 under 60%, Day #41 under 70%
Daily AT40 (T2108)
")
Black line: AT40 (T2108) (% measured on the right)
Red line: Overbought threshold (70%); Blue line: Oversold threshold (20%)
Weekly AT40 (T2108)

*All charts created using freestockcharts.com unless otherwise stated
The charts above are my LATEST updates independent of the date of this given AT40 post. For my latest AT40 post click here.
Related links:
The T2108 Resource Page
You can follow real-time T2108 commentary on twitter using the #T2108 or #AT40 hashtags. T2108-related trades and other trades are occasionally posted on twitter using the #120trade hashtag.
Be careful out there!
Full disclosure: long U.S. dollar, long GLD call options and shares, long TLT puts