
(T2108 measures the percentage of stocks trading above their respective 40-day moving averages [DMAs]. It helps to identify extremes in market sentiment that are likely to reverse. To learn more about it, see my T2108 Resource Page. You can follow real-time T2108 commentary on twitter using the #T2108 hashtag. T2108-related trades and other trades are occasionally posted on twitter using the #120trade hashtag. T2107 measures the percentage of stocks trading above their respective 200DMAs)
T2108 Status: 76.7% (9th day of overbought conditions)
T2107 Status: 72.4%
VIX Status: 12.0 (just above 11-month closing low set two days ago at 11.8)
General (Short-term) Trading Call: bullish
Active T2108 periods: Day #112 over 20%, Day #18 over 30%, Day #17 over 40%, Day #16 over 50%, Day #11 over 60%, Day #9 over 70% (overbought)
Commentary
The S&P 500 (SPY) is essentially adrift in a sea of all-time highs. Each new milestone is barely a nautical inch past the last one. Today, the S&P 500 closed at 2175.03. This all-time high beat out the last one set two days ago….at 2173.02. The all-time high before that started the week with a close of… 2166.89. The index gained 0.6% for the week.
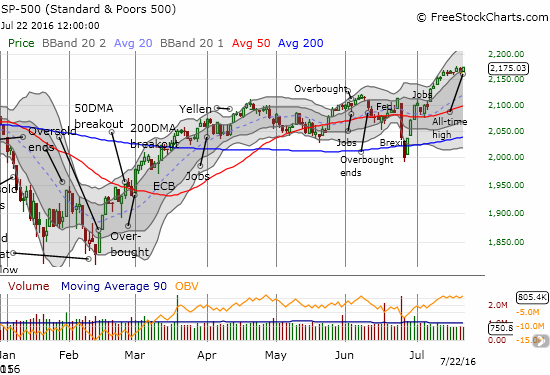
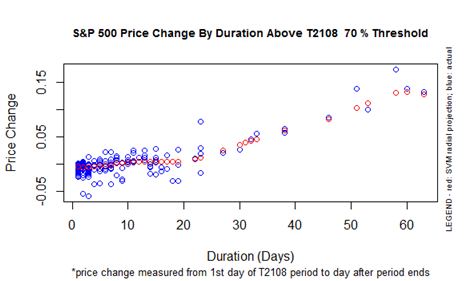
T2108 closed at 76.7%. My favorite technical indicator has gone absolutely nowhere since it first burst into overbought territory with a close of 78.3%. Again, as a reminder, the lack of progress for T2108 in overbought territory is not a problem. Dropping OUT of overbought territory would be a (bearish) problem. T2108 is now just about halfway to lift-off into forming an extended overbought rally. The S&P 500 has gained 1.1% since entering overbought conditions. This performance is just above expectations if overbought conditions ended on Monday (which means that the an end Monday would likely bring performance in-line).
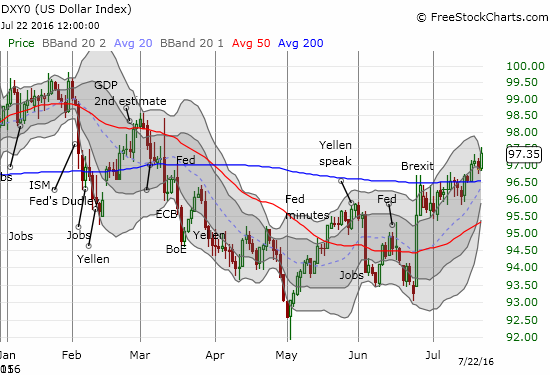
I am increasingly fascinated with the S&P 500’s ability to levitate despite the growing strength in the U.S. dollar index (DXY0) and the decline of oil (USO). In both cases, the market has had periods of obsession with correlations between each of these instruments and the stock market. Those correlations have been completely broken for some time now, and the financial media seem generally silent on the issue. These dynamics just demonstrate yet again that these relationships matter until they don’t. In fact, I will not be surprised to find some crack analyst comfortably concluding, with a hint of irony, that declining oil prices are supporting the market because of the discount for American consumers.
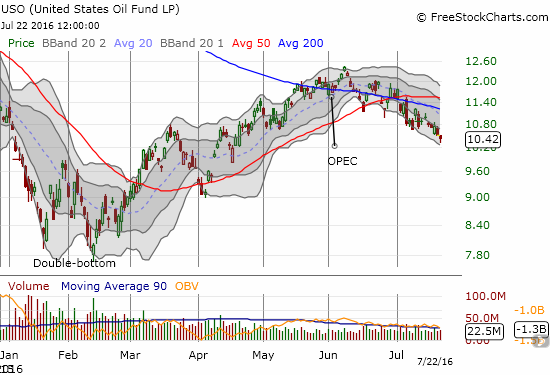
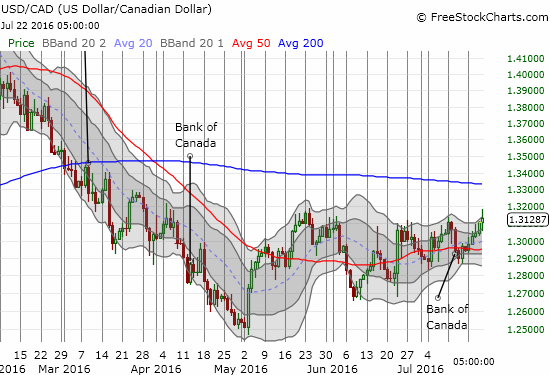
I included USD/CAD as potential evidence that oil’s decline, USO’s breakdown, could be for real, that is, lasting.
I am still wary about the volatility index, the VIX, with it sitting around 11-month lows. Thursday’s surge on a minute loss on the S&P 500 perhaps shows the readiness and willingness of market participants to rush for protection at the slightest disturbance.
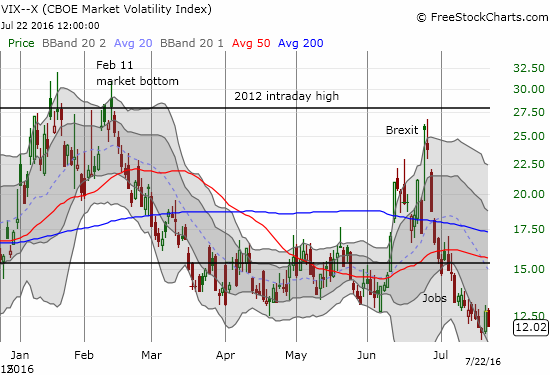
I am always amazed to see volatility this low during earnings season. So far though, earnings season has caused little to no disturbance in the general market. Of course, specific stocks have had plenty of fireworks. I have focused in on those for post-earnings trading with varying degrees of success.
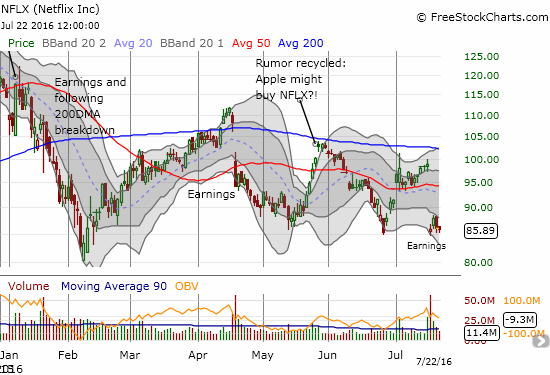
Netflix (NFLX) is having a VERY rough year. For the third time in a row this year, the stock has met sellers in the immediate wake of earnings. The folks who have bought into NFLX on the bounces have all eventually been disappointed. The latest earnings was another disaster with NFLX dropping into a test of its post-Brexit low. I somehow managed to play the immediate bounce fine. On today’s follow-through selling, I went back to my hedged trade of calls and puts. This time I extra-weighted the put side – the lower-Bollinger Band (BB) is opening up and ready to accept fresh sellers.
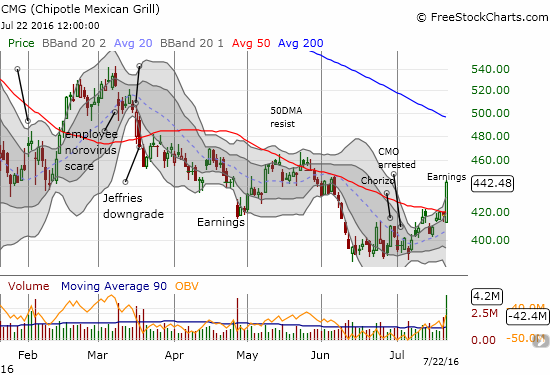
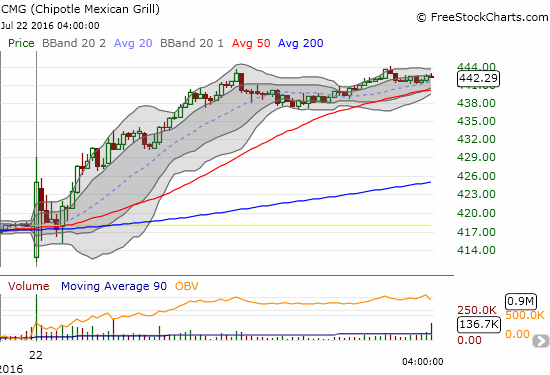
Chipotle Mexican Grill (CMG) was a huge surprise in its post-earnings trading. The stock lost over 2% in after hours trading as a result of what seemed to be an underwhelming earnings report. Analysts seemed to rush to lament the results. However, after a gap down open, buyers went right to work and sent the stock soaring well past the upper-Bollinger Band (BB). This move looks like the work of short-covering. I ended up with put options on a bet the stock fades back at least to its 50-day moving average (DMA). On an intraday basis, this is exactly what CMG did after the first surge of buying. If analysts take this buying as a signal that they need to read CMG’s results with rosier glasses, next week COULD turn into a further rout for shorts. It should be electric either way.
In other trades, I sold my call options on ProShares Ultra S&P500 (SSO) for a small loss after letting a small profit earlier in the week slip through my hands. My next bullish trade on the index is with SPY call options expiring in another two weeks. My call options on Wynn Resorts (WYNN) expired worthless, but I stubborn hit the refresh button. I am still admiring the resilience of the stock even as analysts continue to downgrade ahead of earnings on July 28th (I keep recalling how Steve Wynn loaded up on his company’s stock back in December – granted at much lower prices). Now a Bollinger Band (BB) squeeze is forming which suggests a big move is ahead, up or down. I sure hope that the analysts are getting this one wrong…
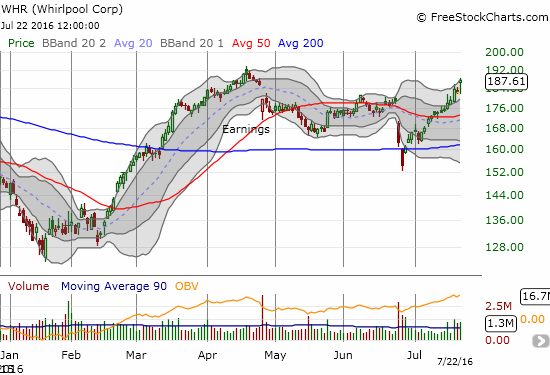
Finally, I have a mea culpa on Whirlpool (WHR). In the pressing negativity of Brexit, I scoffed at WHR’s rush to re-affirm guidance. The market knew better. WHR is up a whopping 21% since its post-Brexit low. I am now not so sure I should be fading this stock ahead of earnings!
— – —
Reference Charts (click for view of last 6 months from Stockcharts.com):
S&P 500 or SPY
U.S. Dollar Index (U.S. dollar)
EEM (iShares MSCI Emerging Markets)
VIX (volatility index)
VXX (iPath S&P 500 VIX Short-Term Futures ETN)
EWG (iShares MSCI Germany Index Fund)
CAT (Caterpillar).
IBB (iShares Nasdaq Biotechnology).
Daily T2108 vs the S&P 500
")
Black line: T2108 (measured on the right); Green line: S&P 500 (for comparative purposes)
Red line: T2108 Overbought (70%); Blue line: T2108 Oversold (20%)
Weekly T2108

*All charts created using freestockcharts.com unless otherwise stated
The charts above are the my LATEST updates independent of the date of this given T2108 post. For my latest T2108 post click here.
Related links:
The T2108 Resource Page
Be careful out there!
Full disclosure: long SPY call options, long WYNN call options, long UVXY shares, net long the U.S. dollar, long and short CAD, have a hedged play on USO