
(T2108 measures the percentage of stocks trading above their respective 40-day moving averages [DMAs]. It helps to identify extremes in market sentiment that are likely to reverse. To learn more about it, see my T2108 Resource Page. You can follow real-time T2108 commentary on twitter using the #T2108 hashtag. T2108-related trades and other trades are occasionally posted on twitter using the #120trade hashtag. T2107 measures the percentage of stocks trading above their respective 200DMAs)
T2108 Status: 71.3% (1st day of overbought conditions, following a day that ended a 12-day overbought period)
T2107 Status: 71.3%
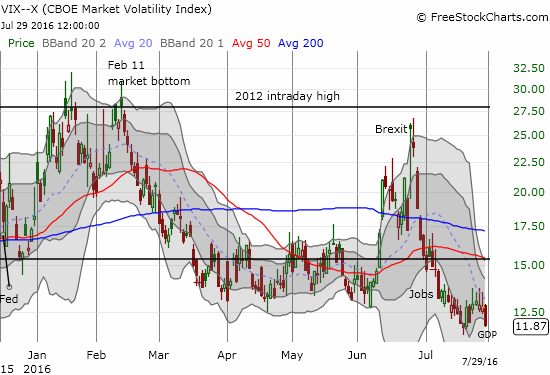
VIX Status: 11.9 (just above 11-month closing low set on July 20th)
General (Short-term) Trading Call: cautiously bullish
Active T2108 periods: Day #117 over 20%, Day #23 over 30%, Day #22 over 40%, Day #21 over 50%, Day #16 over 60%, Day #1 over 70% (overbought)
Commentary
In the previous week, a strengthening U.S. dollar and weakening oil prices failed to stand in the way of new all-time highs on the S&P 500 (SPY). Last week, a slew of economic news, earnings news, and monetary policy decisions had absolutely NO net impact on the index. Buyers jumped on every slight dip, but still failed to set a new all-time closing high.
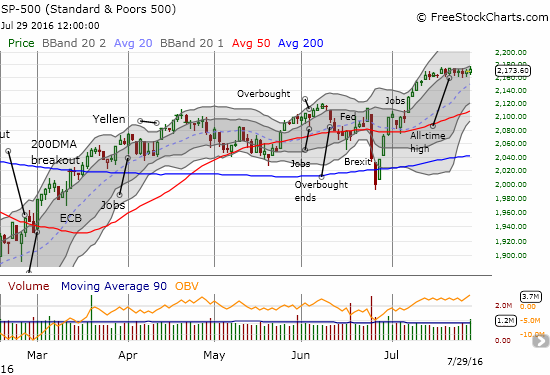
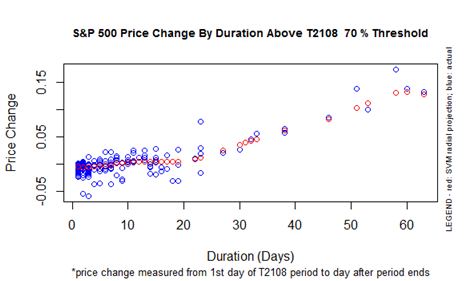
Technical changes also failed to move the S&P 500. T2108, the percentage of stocks trading above their respective 40-day moving averages (DMAs), dropped out of overbought conditions for a day and created a bearish divergence with the index. On Thursday, July 28th, T2108 ended a 12-day overbought period. This is a bearish event, but the close was so marginal at 69.9%. On Friday, T2108 bounced right back into overbought conditions with a 71.3% close. I have downgraded my trading call to cautiously bullish to reflect the momentary, yet important, hiccup and weakness in T2108. Also note that the S&P 500 gained a mere 0.8% during the last overbought period. This is a slight under-performance compared to historical performances and projections.
This juncture is a fascinating one for the market. The chart of the S&P 500 suggests a LOT of potential upside exists if the index manages a breakout. Given the placement of the upper-Bollinger Band (BB), my first target would be 2200. Yet, T2108 is showing signs of weakness and suggesting the index’s levitation is not sustainable. Moreover the volatility index, the VIX, plunged and is yet again plumbing levels that must be a low and must proceed a big volatility run-up. I find this drop ever more mysterious given the resurgence of the Japanese yen combined with a disappointingly weak U.S. GDP report. (I will cover these topics more fully in another post focused on forex).
Consolidation periods can simplify trading decisions. A breakout is bullish, a breakdown is bearish. T2108 should reinforce either move with a continuation of overbought above and an end to overbought with a breakdown. I still have call options on SPY based on the signals earlier in the last overbought period.
While the S&P 500 goes nowhere, plenty of action continues in individual stocks, especially around earnings.
The most bullish move of the week, for me, was seeing Caterpillar (CAT) race higher to a new 52-week high in response to earnings.
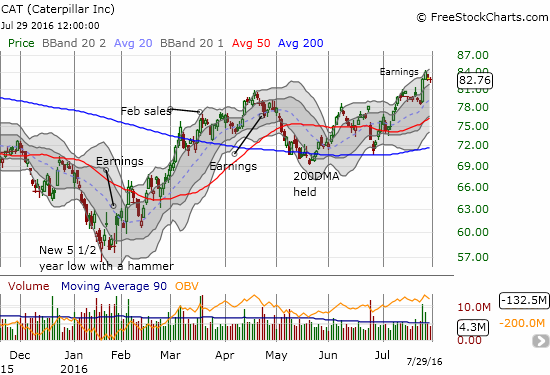
While my bearish position in CAT blew up soon after the bounce from post-Brexit lows, I received SOME consolation in the prior week when Joy Global (JOY) popped an additional 17% on news of a buyout by Komatsu. I last mentioned my strategy for going long JOY back in April. I sold my latest tranche of call options into the gap up.
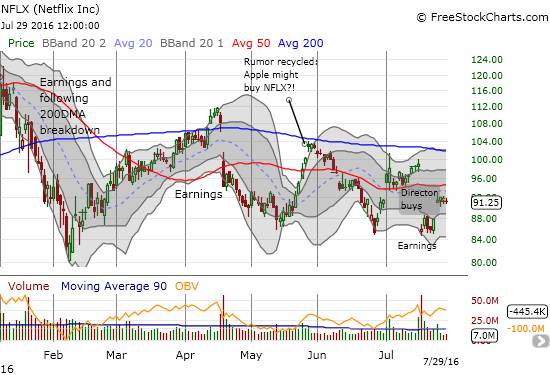
Netflix continues to demonstrate sudden bursts of volatility. This past week it was news of a major purchase by a director that sent shares gapping up 4.2%. I typically only care about the insider buys of company executives, not directors, but these 600K shares worth about $51.9M is a very serious commitment! Nevertheless, shares sold off from the highs on the day and made no further progress during the week. NFLX should continue to be a good strangle play: out of the money call and put options. Either NFLX will break out and fill its post-earnings gap down or it will lose its latest momentum by returning to post-earnings weakness. For the last week, my position collected marginal profits as I was over-weighted puts. With the bias turning slightly more bullish, I will go back to more balanced strangles.
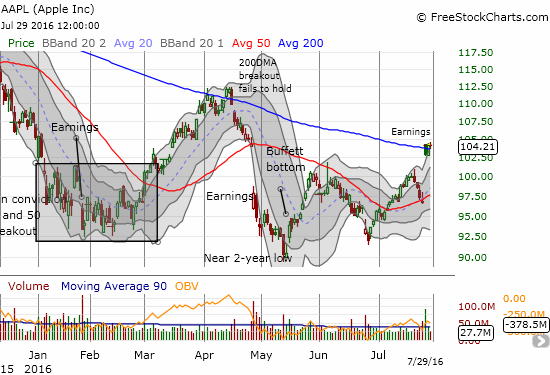
Speaking of major buy signals, the Warren Buffett bottom for Apple (AAPL) now looks firm and secure. AAPL posted a major earnings surprise, and the market responded with AAPL’s second largest one-day percentage surge in its history (the largest occurred in response to April, 2014 earnings). I was unfortunately on the sidelines for this one even though July earnings is a very close second to April in the likelihood of positive post-earnings outcomes (it is now tied – stats measured since 2007). The post-earnings breakout was enough to launch AAPL above 200DMA resistance, but it faded under this important long-term trendline. AAPL got bullish again with a close above its 200DMA the next day. The stock now needs to avoid a repeat of April’s 200DMA fakeout. I went ahead and bought call options that expire in two weeks as a bet that THIS time is different. Even if this short-term position fails, I like buying AAPL on dips going forward all the way to a close of the post-earnings gap up – which happens to correspond roughly to 50DMA support.
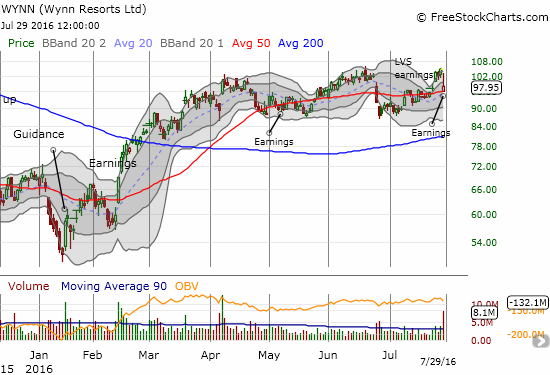
I have posted on Wynn Resorts Ltd (WYNN) several times this year. Last week I noted I stubbornly opened a fresh tranche of call options given the stock’s apparent resilience in the face of multiple analyst downgrades. After Las Vegas Sands (LVS) reported strong earnings, WYNN gapped up in sympathy. I sold into that gap; there is no need to risk the profits to earnings. The move turned out fortuitous as WYNN gapped back down to 50DMA support in the wake of earnings. The stock was up by as much as 2% in after-market trading. I am guessing more sour faces from analysts helped to drive the stock lower after the open. I am looking to get right back into a new position in the coming week.
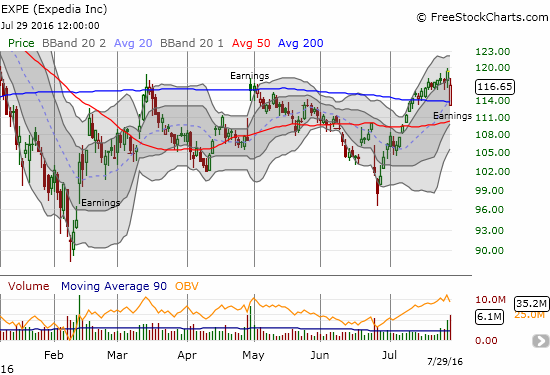
Expedia (EXPE) added its name to the list of stocks with major comebacks from post-earnings lows. The stock gapped down to 200DMA support and never looked back. Perhaps a confident Barclays reiteration of an overweight rating and a boosted price target from $120 to $130 helped the cause. A break above $120 will be very bullish. A close below 200DMA support will be very bearish. All sorts of volatility should happen in between.
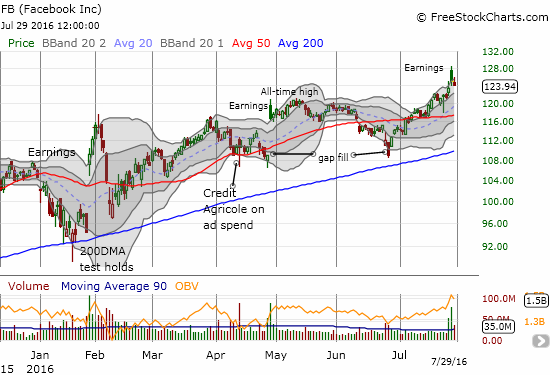
I have to mention Facebook (FB) when talking fascinating post-earnings moves. FB gapped up 4.0% to a fresh all-time high. Yet, just as it did with April earnings, FB crapped out from there. THIS time, FB almost erased its entire post-earnings gain after the gap and crap. I would note that this move is a bearish sign except that FB has posted post-earnings gains since July, 2015 and EACH time filled the gap by the time earnings came around again. In other words, FB is not one to chase, but it IS one to buy on dips. I went ahead and bought a monthly call spread expiring in August in anticipation of a relatively quick comeback. Just like with AAPL, even if this comeback fails to materialize, I will be looking for another buying opportunity.
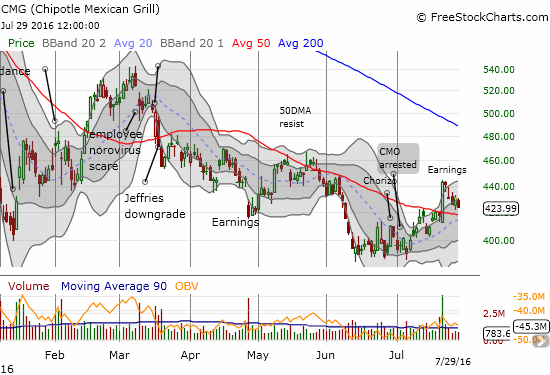
Last week, I claimed that Chipotle Mexican Grill (CMG) would reverse its post-earnings gains back to its 50DMA. The low of the week essentially accomplished the mission. However, the fade was too slow to amount to much of a profit on my last tranche of put options. At least I was nimble enough to close near those lows.
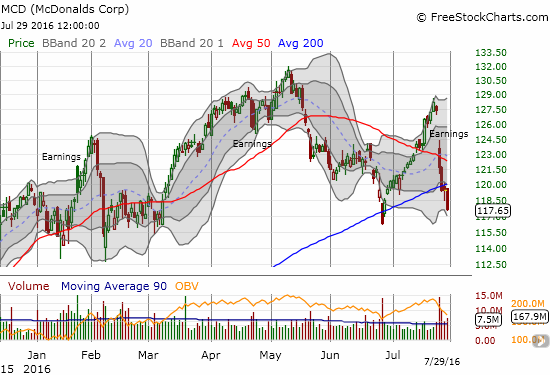
On the even more bearish side of earnings, McDonald’s was knocked down this week enough to break 200DMA support. After going nowhere from 2012 to 2015 and suffering through a lot of investor and market doubts, MCD broke out to a new all-time high in October of last year. The new all-time highs ended in May of this year.
— – —
Reference Charts (click for view of last 6 months from Stockcharts.com):
S&P 500 or SPY
U.S. Dollar Index (U.S. dollar)
EEM (iShares MSCI Emerging Markets)
VIX (volatility index)
VXX (iPath S&P 500 VIX Short-Term Futures ETN)
EWG (iShares MSCI Germany Index Fund)
CAT (Caterpillar).
IBB (iShares Nasdaq Biotechnology).
Daily T2108 vs the S&P 500
")
Black line: T2108 (measured on the right); Green line: S&P 500 (for comparative purposes)
Red line: T2108 Overbought (70%); Blue line: T2108 Oversold (20%)
Weekly T2108

*All charts created using freestockcharts.com unless otherwise stated
The charts above are the my LATEST updates independent of the date of this given T2108 post. For my latest T2108 post click here.
Related links:
The T2108 Resource Page
Be careful out there!
Full disclosure: long SPY call options, long UVXY shares, long FB call spread, long AAPL call options