
(T2108 measures the percentage of stocks trading above their respective 40-day moving averages [DMAs]. It helps to identify extremes in market sentiment that are likely to reverse. To learn more about it, see my T2108 Resource Page. You can follow real-time T2108 commentary on twitter using the #T2108 hashtag. T2108-related trades and other trades are occasionally posted on twitter using the #120trade hashtag. T2107 measures the percentage of stocks trading above their respective 200DMAs)
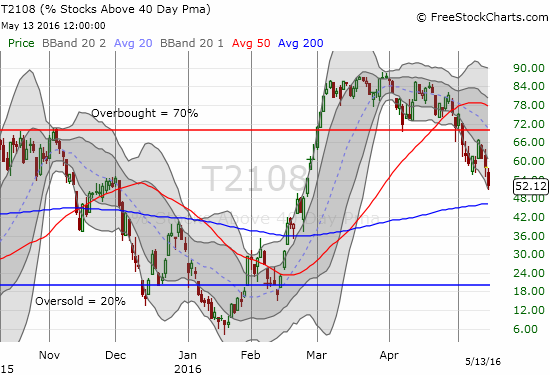
T2108 Status: 52.1%
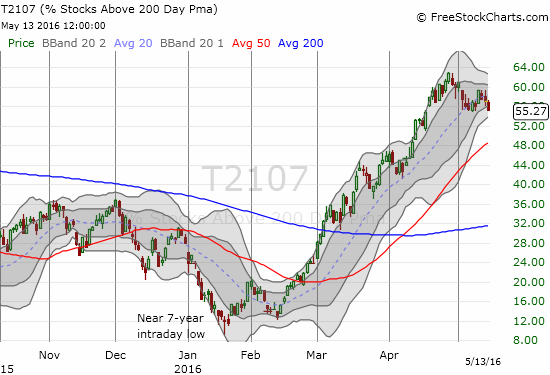
T2107 Status: 55.3%
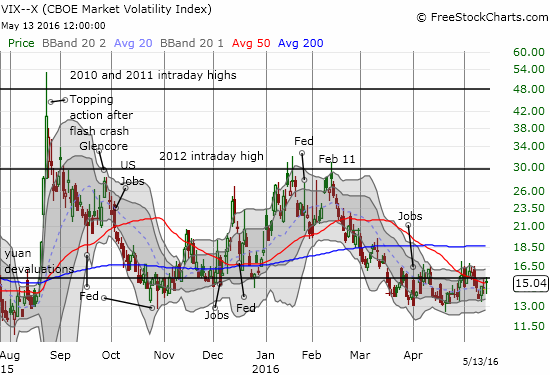
VIX Status: 15.0
General (Short-term) Trading Call: bearish
Active T2108 periods: Day #64 over 20%, Day #63 over 30%, Day #60 over 40%, Day #57 over 50% (overperiod), Day #2 under 60% (underperiod), Day #9 under 70%
Commentary
May 10, 2016 may be the closest the stock market gets to overbought status for a good while to come.
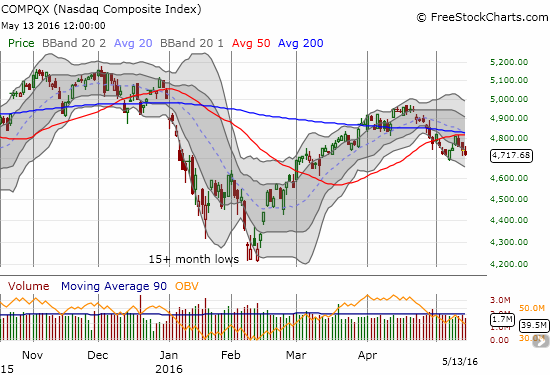
In the last T2108 Update, I noted how a jump in T2108 toward overbought status (to 66.8%) solidified the case of buyers. The S&P 500 (SPY) gained 1.3% on a day that looked like convincing follow-through to the line in the sand buyers drew at 50-day moving average (DMA) support. However, buyers did not follow-through from there. After three days of selling, the index has slipped under 50DMA support. The selling has also confirmed 50DMA resistance for the NASDAQ (QQQ).
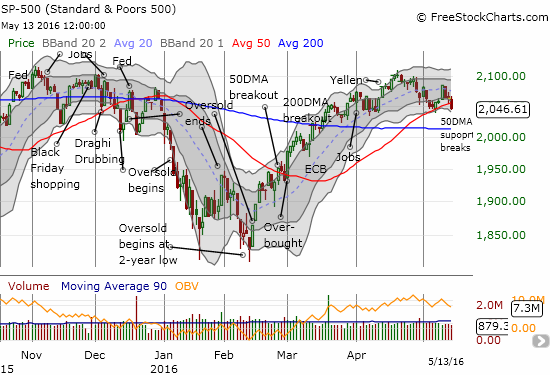
The S&P 500 closed essentially flat with the price level where buyers successfully defended 50DMA support in the previous week. So one might wonder why this 50DMA breakdown is alarming. This is a perfect situation for T2108, the percentage of stocks trading above their respective 40DMAs, to reveal the real underlying story. T2108 plunged to a 3+ month low in a move that resumes a downtrend that started in late April. T2108 closed at 52.1%, 4 percentage points below its low when buyers defended the S&P 500’s 50DMA. In other words, while the S&P 500 is fighting to stay level, stocks in general are failing to keep up: this divergence firms up my bearishness.
T2107, the percentage of stocks trading above their respective 200DMAs, closed at 55.3%. T2107 is still trying to hang in there.
The volatility index, the VIX, is also trying to keep hope alive for buyers and bulls. The VIX is still not making major moves upward and has not (yet?) broken out above the 15.35 pivot line.
There are a stark set of charts that say loud and clear that the nature of trading has taken on a definitive bearish tone. T2108, the major indices, and charts like these explain why I have shifted my short-term trading bias from “cautiously bearish” to just plain ol’ “bearish.”
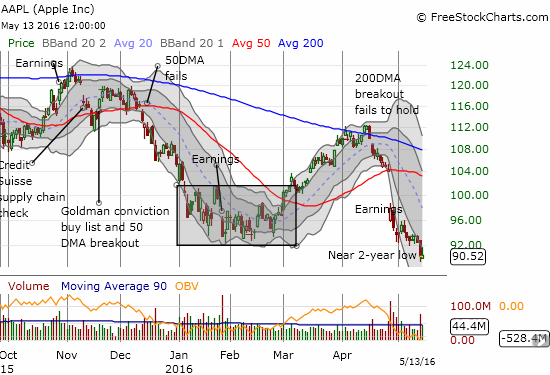
Apple (AAPL) broke down to a fresh 2-year low on Thursday. The stock closed below the period of consolidation that at one time gave Apple a bullish polish. Now, all traders and investors must be wondering when in the world Tim Cook’s billions will get put to work to carve a fresh attempt at a bottom for the stock.
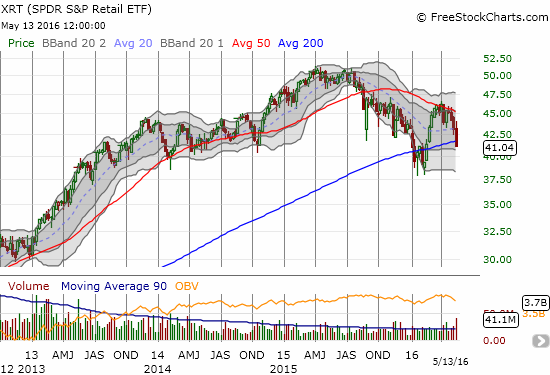
Retailers took a huge hit this week. One after another, the earnings reports disappointed severely and generally stunk up the joint. SPDR S&P Retail ETF (XRT) started off the week with an impressive 1.6% gain. At Friday’s close, XRT finished with an overall 4.6% LOSS for the week. The dual breakdown from 50 and 200DMAs at the end of April is definitely confirmed now. I show the weekly chart of XRT to make the bearishness crystal clear. The pattern is not quite a head and shoulders top, but all XRT needs to do now is break the recent lows to confirm a top.
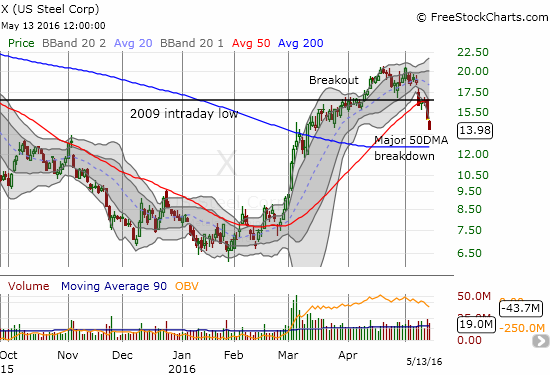
In the last T2108 Update, I noted how U.S. Steel (X) was trying to hold support at a convergence of its 50DMA and the 2009 intraday low. The support collapsed in dramatic fashion in the last two days of the week. X’s 200DMA breakout now looks like a top. The presumed catalyst for this tumble comes from an analyst who reiterated his $5 year-end price target. Time is obviously ticking on that call, but he thinks that China will still manage to dump a lot of steel in the U.S. despite new tariffs. I am personally skeptical. I also think that these kinds of trigger reactions get reversed, so brave traders could try a swing back to resistance (formerly support)…especially with the stock over-extended below the lower Bollinger Bands (BBs). My bearish call on the market prevents me from trying such a trade. Indeed, the willingness of investors to sell in a panic on this kind of analyst call provides yet one more sign of souring market sentiment.
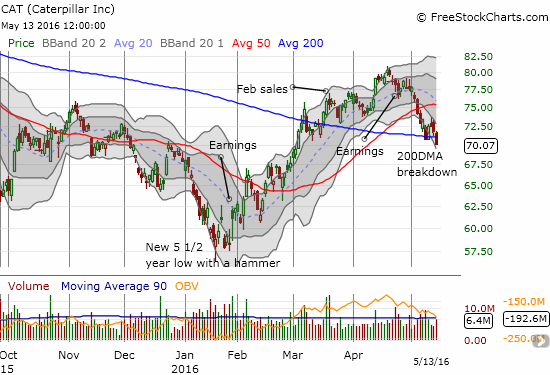
Sticking with the industrial space, Caterpillar (CAT) provided confirmation for my bearishness by breaking through 200DMA support. The lower Bollinger Bands are guiding CAT into a definitive downtrend. From here, I see no strong “natural” levels of support until CAT retests the 2016 low.
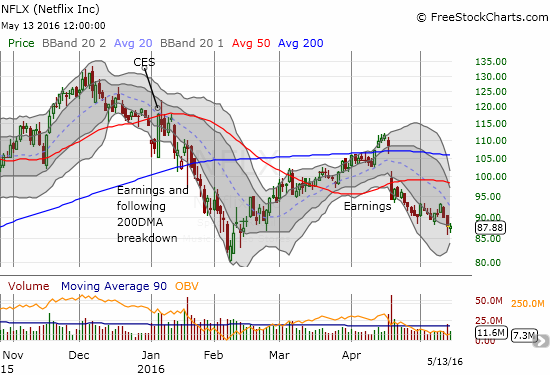
On Thursday, Netflix (NFLX) took a deep dive on high selling volume. This selling confirms post-earnings weakness. The stock looks ready to retest 2016 lows but a growing Bollinger Band squeeze could have other plans for the stock; resolution of the squeeze could hurtle the stock for a major move up or down. I have watched NFLX for (bearish) entry points ever since it gapped down post-earnings. Thursday was a nice winner as I played the fresh breakdown and bailed after the stock was down (a surprising) 5%.
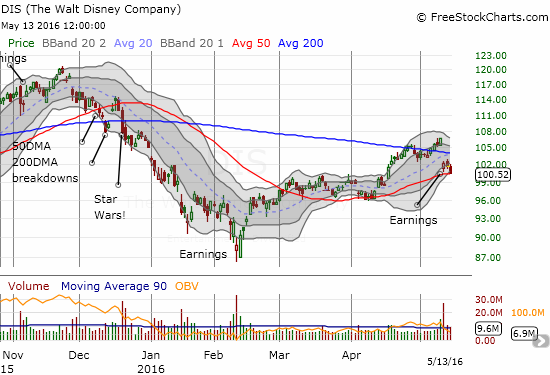
My big disappointment for the week was Disney (DIS). My long-term call position finally turned back to green ahead of earnings. I could tell traders were anticipating a big move because the value of those call options really surged going into earnings. I did not sell since the options have January expiration. Despite my growing misgivings about the general market, I allowed my belief in Disney to suspend suspicion. Disney’s bullish 200DMA breakout turned into a post-earnings breakdown. Friday’s test of 50DMA support looks like it will easily fail given the high volume selling still in place. Overall, DIS is looking more and more like a major laggard. I cannot see how the stock gets back to all-time highs anytime soon when all the recent and coming big news have failed to support DIS better.
One stock stands out like a “thumbs up” in all this carnage: Amazon.com (AMZN). Despite the breakdown in the NASDAQ, despite the increasingly bearish market sentiment, AMZN broke OUT this week to a fresh all-time high. Even during Friday’s downdraft, AMZN held firm to the uptrend defined by the upper Bollinger Bands (BBs). While this relative strength is definitely impressive, AMZN’s resilience simply reminds me of this time last year when a few big cap (tech) stocks flew high and stayed tough despite the weakening that was plain to see in T2108. The main difference now is that the major indices are not cooperating in providing an air of serene calm on water’s surface; the trouble roiling underneath is bubbling to the surface.
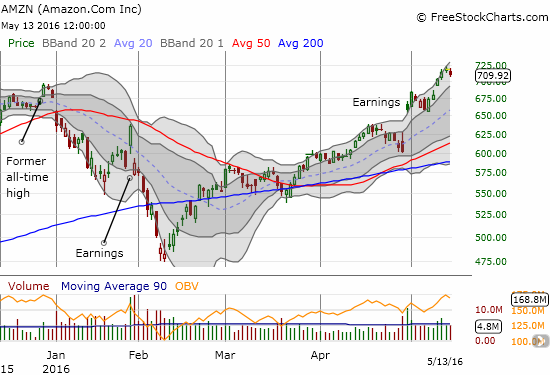
AMZN seems to be a main point of “safety” for investors fleeing breakdowns elsewhere. Perhaps retail investors are trading in their shares of traditional box stores and others for shares of growth and upward momentum. As money piles into the few strong stocks left, instability merely grows. The likes of AMZN simply cannot lead the entire market to a turnaround in market sentiment. This dynamic will be important to watch.
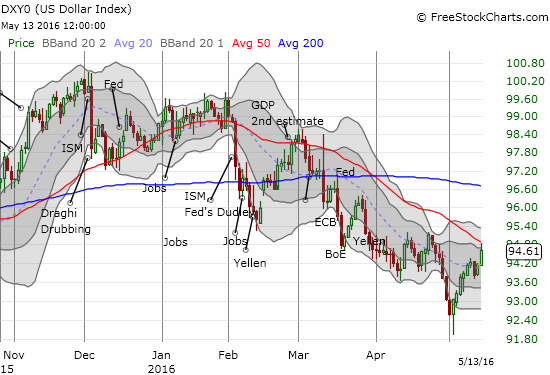
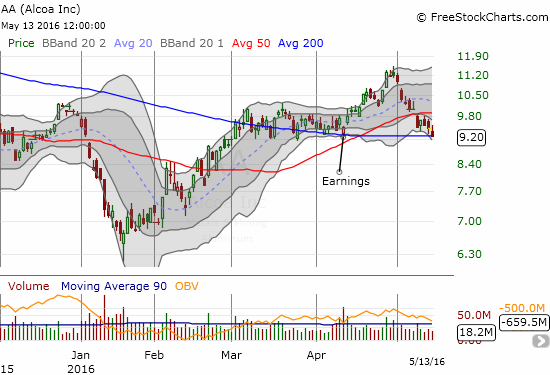
Finally, I have the U.S. dollar (DXY0). Its bottoming process faces its first major test at the 50DMA downtrend as resistance. Given conventional wisdom about the dollar, I think pundits will assume a breakout augurs poorly for stocks. However, given past behavior, a failure to break resistance is not likely to save the market either. I am watching closely for clues on how to trade commodities going forward. For example, Alcoa (AA) was on my list to buy as it hovered over 50DMA support. I took it off the list after it proceeded to break down the very next day. Now, the stock rests right on 50DMA support as all its post-earnings gains have reversed.
— – —
Reference Charts (click for view of last 6 months from Stockcharts.com):
S&P 500 or SPY
U.S. Dollar Index (U.S. dollar)
EEM (iShares MSCI Emerging Markets)
VIX (volatility index)
VXX (iPath S&P 500 VIX Short-Term Futures ETN)
EWG (iShares MSCI Germany Index Fund)
CAT (Caterpillar).
IBB (iShares Nasdaq Biotechnology).
(Reload page and/or click on the image, if it is not correct. At time of writing, server is having cache issues)
Daily T2108 vs the S&P 500
")
Black line: T2108 (measured on the right); Green line: S&P 500 (for comparative purposes)
Red line: T2108 Overbought (70%); Blue line: T2108 Oversold (20%)
Weekly T2108

*All charts created using freestockcharts.com unless otherwise stated
The charts above are the my LATEST updates independent of the date of this given T2108 post. For my latest T2108 post click here.
Related links:
The T2108 Resource Page
Expanded daily chart of T2108 versus the S&P 500
Expanded weekly chart of T2108
Be careful out there!
Full disclosure: long CAT put spread and options, long and short various currencies versus the U.S. dollar, long DIS call options