
(T2108 measures the percentage of stocks trading above their respective 40-day moving averages [DMAs]. It helps to identify extremes in market sentiment that are highly likely to reverse. To learn more about it, see my T2108 Resource Page. You can follow real-time T2108 commentary on twitter using the #T2108 hashtag. T2108-related trades and other trades are posted on twitter using the #120trade hashtag)
T2108 Status: 38.4% (ends 3 straight days of quasi-oversold conditions)
VIX Status: 16.6
General (Short-term) Trading Call: Take some profits. Stay long with smaller position.
Active T2108 periods: previous 40% overperiod ended at 32 days; Day #2 under 40% (underperiod), Day #11 under 70% (underperiod)
Reference Charts (click for view of last 6 months from Stockcharts.com):
S&P 500 or SPY
SDS (ProShares UltraShort S&P500)
U.S. Dollar Index (volatility index)
VIX (volatility index)
VXX (iPath S&P 500 VIX Short-Term Futures ETN)
EWG (iShares MSCI Germany Index Fund)
CAT (Caterpillar)
Commentary
This is a quick update given the June unemployment report should throw the market for loops on Friday.
The T2108 Trading Model (TTM) came through yet again with a near-perfect read from the script I laid out in the last T2108 Update. I got the retest and violation of 50DMA support, and my trades to add to my Pro Shares Ultra S&P 500 (SSO) calls triggered. The S&P 500 soon recovered and printed a very strong close. This move delivered the up day that the TTM predicted based on quasi-oversold conditions coming into today. I locked in some profits by selling 40% of my calls into the closing strength. If there were no jobs report causing a huge level of uncertainty in the market, I would have held onto the entire position. As it is, I am carrying a huge risk into Friday morning that the S&P 500’s close right at the bear/bull dividing line (now resistance) will tightly cap the one-day rally.
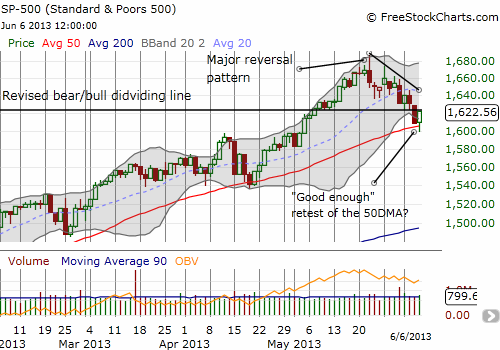
I will almost certainly sell my remaining SSO calls on the market’s next show of strength. I continue to assume the looming downtrend will hold for some time.
Regardless, I think today’s performance has sealed the deal on giving me confidence that the TTM can and will provide good trading guidance. My task this summer is to finally sit down to document the model in a way that is accessible to folks not conversant in machine learning and data mining. I also need to do more programming to extend the model into more T2108-related scenarios.
At least two stocks deserve special attention given they failed to rally on Thursday’s bounce.
I noted Caterpillar (CAT) in the last T2108 Update, saying that it was likely to continue declining no matter what happened to the S&P 500. The stock was off about 1% at the lows of the day. The late rally cut the loss in half and left it with a hammer pattern. I am poised to stop out of my puts on a further rise, but CAT remains on “fade watch” on any rally.
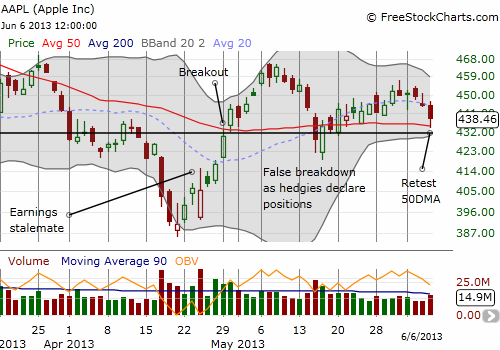
I neglected to post an update on the technical outlook for Apple (APPL) in the last post although I tweeted about it. On Wednesday, I noted that the 20DMA was pointing downward signaling a heightened downside risk and a retest of the 50DMA. I reitereated that concern on Thursday. Sure enough, AAPL tumbled right into its 50DMA. This kind of relative weakness is almost always a bad sign even though AAPL managed to lift slightly off the mat into the close. I continue to watch the mid-May lows. Those lows MUST hold in order for me to feel secure about the Apple bottom I described earlier. (Note that given the typical AAPL cycle of starting the week strong and closing the week meekly, I had put options going into today. My short-term trades almost always try to accentuate this pattern. I sold the puts after it seemed the sell-off would not quite push AAPL into its 50DMA).
Daily T2108 vs the S&P 500
")
Black line: T2108 (measured on the right); Green line: S&P 500 (for comparative purposes)
Red line: T2108 Overbought (70%); Blue line: T2108 Oversold (20%)
Weekly T2108

*All charts created using freestockcharts.com unless otherwise stated
Related links:
The T2108 Resource Page
Expanded daily chart of T2108 versus the S&P 500
Expanded weekly chart of T2108
Be careful out there!
Full disclosure: long SSO calls, long CAT puts and shares, long AAPL shares and call spread